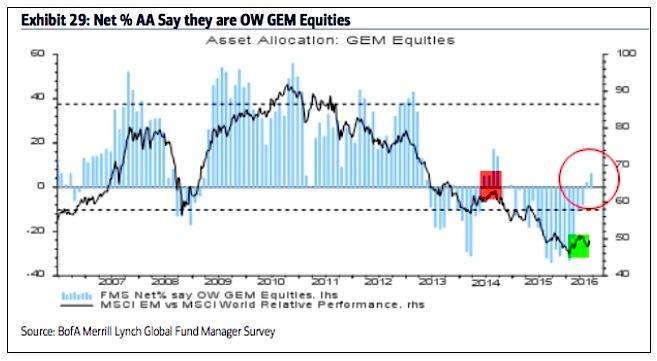
Emerging markets equities: In January, fund managers asset allocations to emerging markets fell to the second lowest in the survey’s history (-33% underweight), an extreme comparable only to early-2014 from which the region began to strongly outperform for the next half a year. Allocations have since risen to +6% overweight, the highest in 21 months, which is still 0.5 standard deviations below the long term mean.
The region has outperformed the rest of the world so far 2016. Allocations are now back to where the rally in mid-2014 failed.
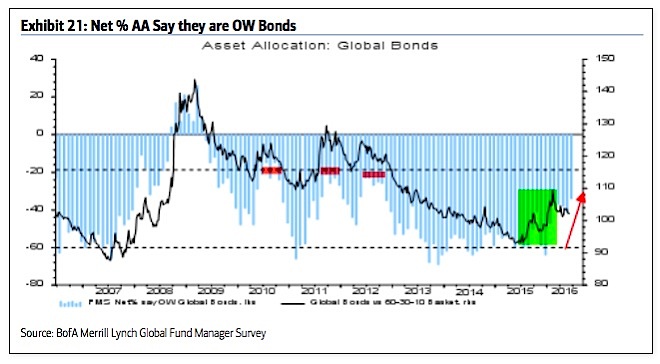
Global bonds: Fund managers are -34% underweight bonds, a 3.5 year high allocation. This is a big rise from -64% underweight in December (a 2-year low allocation). Bonds outperformed in the 10 months before the current equity rally began in February. Note that bonds have historically started to underperform when allocations rise to -20% underweight (red shading). Current allocations are back to their long term mean.
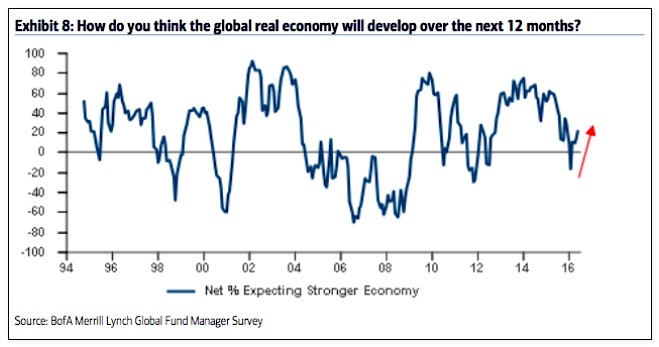
In February, 16% of fund managers expected a weaker economy in the next 12 months, the lowest since December 2011. Investors are still pessimistic, with only 23% expecting a stronger economy in the next year. This explains the low allocations to equities and high allocations to cash.
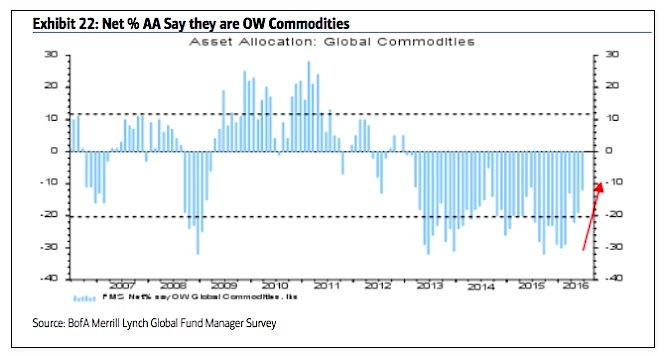
Commodities: Fund managers asset allocations to commodities improved to a 12-month high at -12% underweight. This is just 0.5 standard deviations below the long term mean. In comparison, in February, allocations were near one of the lowest levels in the survey’s history (-29% underweight). The improvement in commodity allocations goes together with that for emerging markets.
Additional Survey details are below:
- Cash (5.7%): Cash balances increased to 5.7% from 5.5%. This is higher than in February (5.6%) and the hight since November 2001. Typical range is 3.5-5%. BAML has a 4.5% contrarian buy level but we consider over 5% to be a better signal. More on this indicator here.
- Equities (+1%): A net +1% are overweight global equities, down from +6% in May and below the +5% overweight in February. Over +50% is bearish. A washout low (bullish) is under +15%. More on this indicator here.
- Regions:
- US (-15%): Exposure to the US rose slightly to -15% underweight from -18% in May; it’s not much different than the -19% underweight in February, which was an 8 year low.
- Europe (+26%): Exposure to Europe was unchanged at +26% overweight.
- Japan (-6%): Exposure to Japan was unchanged at -6% underweight. Funds were -20% underweight in December 2012 when the Japanese rally began.
- EM (+6%): Exposure to EM rose to +6% overweight – a 21-month high – from -33% underweight in January and +2% overweight in May. -34% underweight in September 2015 was the lowest in the survey’s history.
- Bonds (-34%): A net -34% are underweight bonds, a rise from -64% in December and-41% in May. This is a 3.5 year high allocation. Note that global bonds started to underperform in mid-2010, 2011 and 2012 when they reached -20% underweight.
- Commodities (-12%): A net -12% are underweight commodities – a 12-month high – an improvement from -19% last month. Higher commodity exposure goes in hand with improved sentiment towards EM.
- Macro: 23% expect a stronger global economy over the next 12 months; in February, 16% expected a weaker economy, the most pessimistic since December 2011.
Thanks for reading.
Twitter: @ukarlewitz
Read more from Urban’s Fat Pitch Blog
Any opinions expressed herein are solely those of the author, and do not in any way represent the views or opinions of any other person or entity.
: Creating Bullish Divergence?")


 and Semiconductors (SMH): Concerning Price Pattern?")


