The Financial Sector ETF (NYSEARCA:XLF) is still shaking off the stigma of the 2008-2009 collapse.
It’s been nearly 10 years since it peaked… and it’s finally closing in on those all time highs again. And will likely surpass them some time soon.
But that’s just the head line; savvy traders will need to hone in on price action, targets, and risk levels.
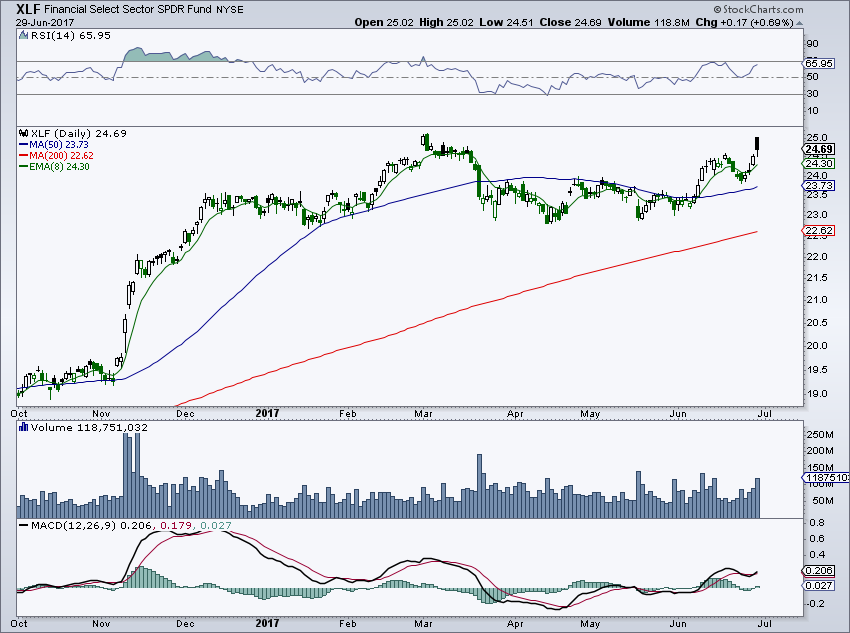
Looking at the “daily” bar chart for the Financial Sector (XLF), we can see that XLF broke out above $24.10 in June and now faces price resistance just above the $25 level. I think the sector breaks out of the current range and runs to an initial target of 27.50. Based on the length of the consolidation, we could see even higher levels than that. That would put us above the all time highs set back in 2007.
XLF Financial Sector – “Daily” Bar Chart
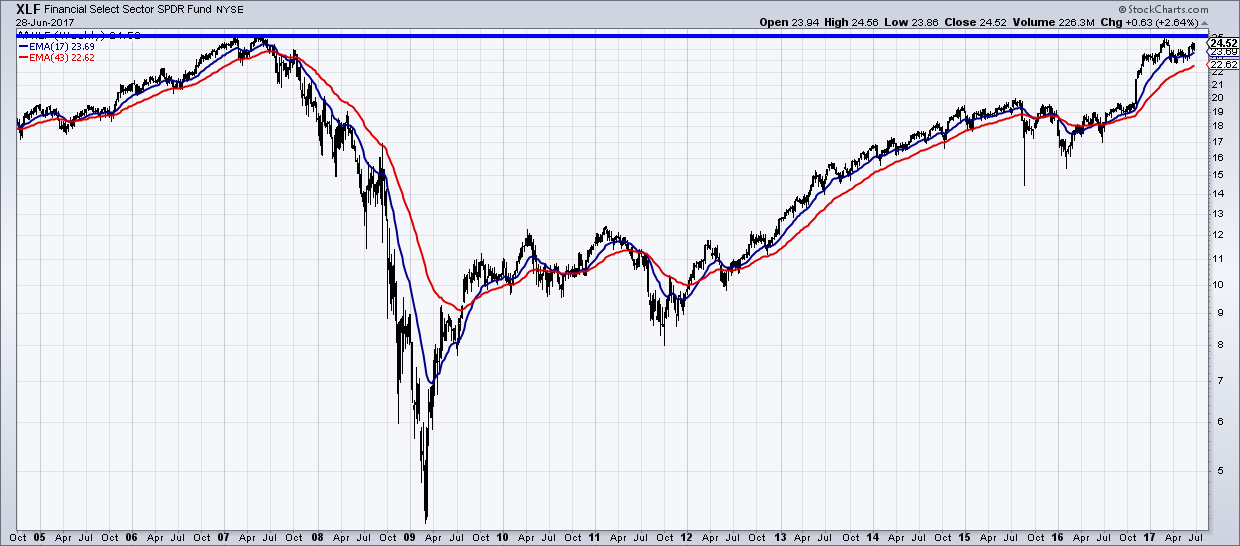
On the weekly chart, we can see how important the $25+ area is for the XLF (and financial stocks). $25.21 was the all time high set way back in May 2007. A strong breakout above this previous high could be very bullish for the financial sector from a longer-term perspective.
XLF Financial Sector – “Weekly” Bar Chart
Feel free to reach out to me at arbetermark@gmail.com for inquiries about my newsletter “On The Mark”. Thanks for reading.
Twitter: @MarkArbeter
Any opinions expressed herein are solely those of the author, and do not in any way represent the views or opinions of any other person or entity.

: Showing Some Signs of Emerging Strength")
