At the beginning of the Chinese New Year 2019, I wrote a lot about the Year of the Brown Earth Pig, whose element is water. Today we look at what it means for Corn (NYSEARCA: CORN).
With the recent selloff, I’d like to remind you of what my favorite astrologer wrote about the symbolism of the pig, water and what that could mean for the market.
To review:
“Pig is the stage when fire is “Terminated” and the fearful water element is going to take over. As water symbolizes fear, there is lacking of optimism in the Pig year and it will bring decline in economic growth and activities leading to longer term setback of the stock market and more economic crisis will come up.
As there will not be return of fire year until 2025, we expect a long-lasting bearish market ahead.”Raymond Lo
This wooden pig is eating corn.

Interestingly, the agricultural commodity corn, has popped substantially off an all-time low it made on 5/13.
Since that day, CORN has risen about 6%.
There are several reasons CORN has rallied off the lows.
From a prediction standpoint, Lo also said that “The industries that will perform well in the year of the Pig will be industries related to Wood element and Earth element. Wood industries are environment, fashion, media, books, education, plants and flowers. Earth industries are property, insurance, mining, high tech.”
If you havent already, please order Plant Your Money Tree: A Guide to Growing Your Wealth! Now on Kindle! Go here: www.marketgauge.com/plantyourmoneytree to receive a special $97 bonus for free while it lasts!
Plants and flowers, given the recent tariffs, seemed like they would be the impossible sectors to rally.
Not only CORN, but also soybeans, wheat, cotton, sugar and coffee have been beat up.
Although the trade war and a slowing of Chinese demand for U.S. grains hit the U.S. grains markets, we now have more concerns about flooding and other weather events that have delayed U.S. plantings.
Incidentally, another part of Lo’s commentary: Besides predictions of “earthquakes, landslides, collapses of buildings and avalanches”, he sees “flooding and heavy rainstorms.”
Does this prove my point I’ve made over and over that commodities can rally for a multitude of reasons, not the least of which is the psychological swtch from a global slowdown and deflation, to a stagflation mindset or “we need to eat!”
The weekly chart if corn the ETF, shows that it has cleared the fastest exponential moving average (dotted line).
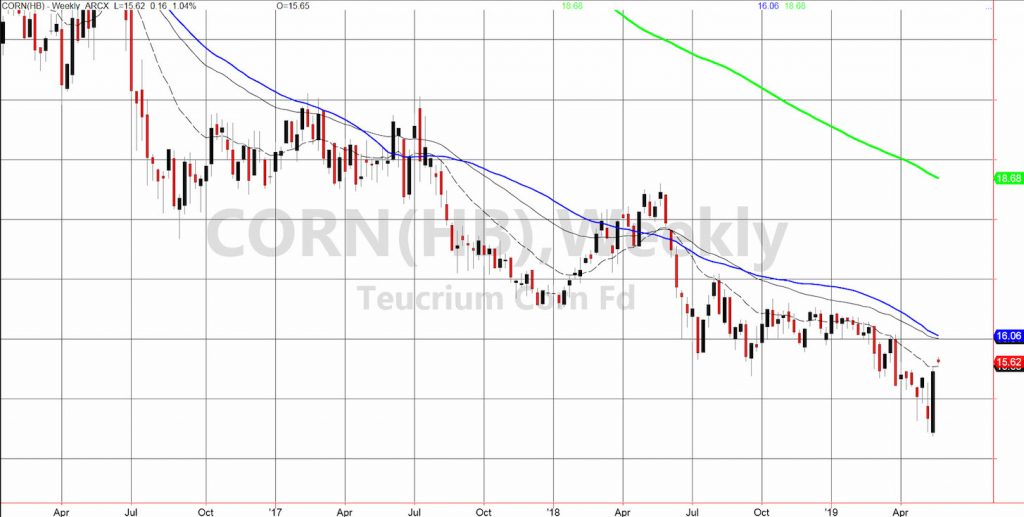
And that’s after an impressive reversal last week.
However, it has major resistance at around 16.05, or where the 50-week moving average is (blue line).
Today, Lo’s prediction looks accurate-stocks down, plants up.
What commodities traders want to see, is that trend continue beginning with CORN clearing the 50-DMA.
S&P 500 (SPY) – confirmed caution phase. 286.64 is the 50-DMA to clear. Support 277.15
Russell 2000 (IWM) – 154.50 resistance. 151.40 support to hold
Dow Jones Industrials (DIA) – 258.50 resistance with 254.50 first area of support.
Nasdaq (QQQ) – The 50-DMA is at 183.49 resistance to clear and 175 the major underlying support.
KRE (Regional Banks) – 54.20 resistance with this in a confirmed bearish phase. 51.31 the 200-WMA.
SMH (Semiconductors) – Fell to 102.20 the 50-WMA. Then, after a meager attempt at a bounce, failed it. Now pivotal.
IYT (Transportation) – Confirmed Distribution phase with 189.32 resistance and 185 next support.
IBB (Biotechnology) – 103.36 the 200 WMA now pivotal resistance.
XRT (Retail) – Under 42.12 expect more weakness.
Twitter: @marketminute
The author may have a position in the mentioned securities at the time of publication. Any opinions expressed herein are solely those of the author, and do not in any way represent the views or opinions of any other person or entity.

: Showing Some Signs of Emerging Strength")
