What we heard from the Fed and FOMC on Wednesday:
- Unanimous
- Holding Rates Allows FOMC To Assess Additional Data
- Tighter Credit Likely To Weigh On Activity
- 2023 Unemployment Seen At 4.1% Vs 4.5%
- Median Rate Forecasts Rise To 5.6% End-`23, 4.6% End-`24 `
- Extent Of Additional’ Firming To Hinge On Economy
Nothing in here is a surprise to us as we have been talking on all the media about the expected pause (skip) this month.
And that the FED would leave the door open for further rate hikes depending on….the DATA.
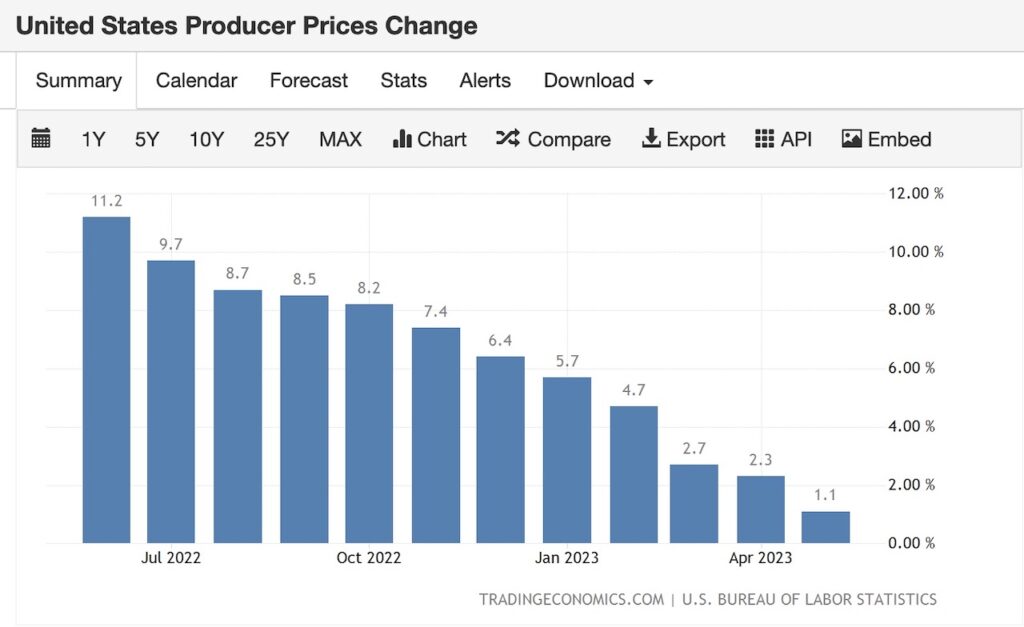
Plus, the PPI decreased for 11 months in a row.
As a chartist, (and logical human who buys things), I’d say we won’t see these lows again in the PPI until 2024
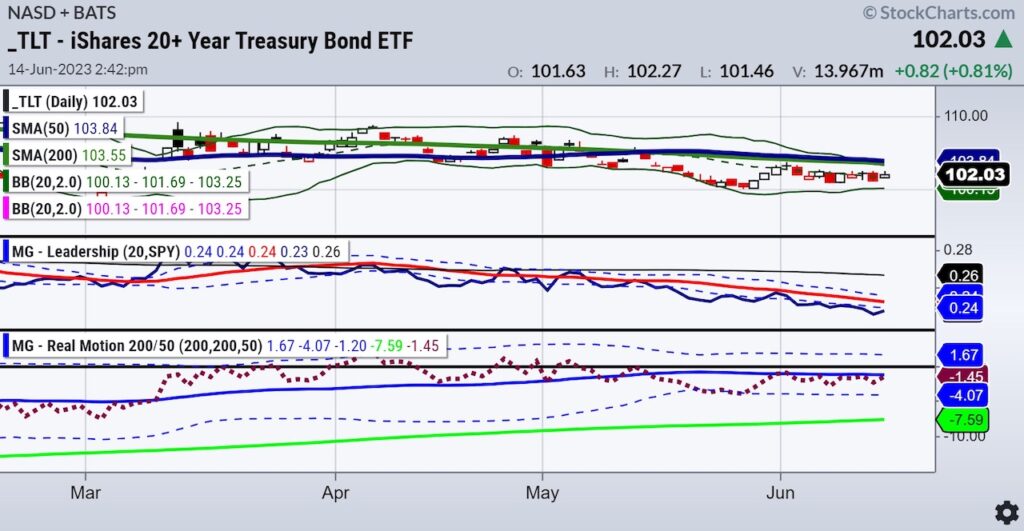
We love to watch the Long Bonds as they are a key factor in our risk gauges that help us see risk on/off.
What might the Long Bonds be telling us?
Back in early March, TLTs had a classic island bottom. Textbook if you do not know what that is:
Following a downtrend, a gap down, consolidation, then a gap up.
The island bottom pattern suggests that buyers have regained control.
And we always preach that it’s a good idea to combine technical analysis with fundamental analysis and consider other factors that may impact price.
For us, it is the TLT chart and the IWM or small cap chart that may be telling both a fundamental and technical story.
And please note, we remain very open-minded.
The TLT chart and the momentum indicator Real Motion has us on the alert for a bullish divergence signal. That means that the red dots can clear the 50-day moving average (blue line) while we wait for price to follow or not.
The Triple Play indicator tells us that risk-on remains while TLTs continue to underperform the market or benchmark. We wait to see if that changes as well.
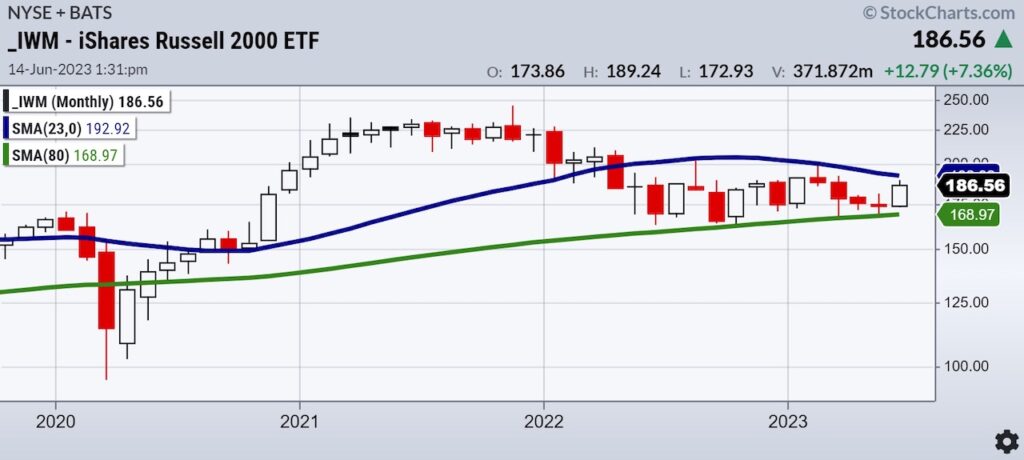
Besides that, the Russell 2000 (IWM) on the monthly chart is right at resistance at the 23-month moving average.
The market is at an incredible inflection point.
If the TLTs rally from here, we expect that IWM will not be able to clear the blue line.
If TLTs fall from here, we still need to see IWM cross over into expansion.
Plus, we are watching the retail and transportation sectors (XRT IYT) carefully.
If the bonds continue to consolidate around current levels, then we will assume a trading range at these higher levels (SPY 410-440) for now until the next round of the…DATA.
Twitter: @marketminute
The author may have a position in mentioned securities at the time of publication. Any opinions expressed herein are solely those of the author and do not represent the views or opinions of any other person or entity.


: Showing Some Signs of Emerging Strength")
