February 29 stock market futures are mixed after having a big expansion into significant resistance during pre-market on Friday. Thus far, we have retraced and moved into support level tests, as expected.
The Morning Report: Charts Working Through Congestion
See Friday’s post for this reference. I expected charts to hold 1944 but we slipped below that to 1934.75 at this writing. Buyers should be very concerned that we hold the 1929 region on the S&P 500 futures.
If we fail to hold that level, we should see 1918-1914.
However, a breach of 1944 will give us a bounce to 1948 and perhaps 1954.75. Lots of news releases today.
Momentum on the four hour chart of February 29 stock market futures for the S&P 500 is sloping negative, and in neutral territory – range based trading formations. The S&P 500 futures daily charts read momentum as trending mildly positive, and in positive territory – suggesting support levels will bring buyers to the rescue once more.
Shorter time frame momentum indicators are sitting in negative territory, and sloping up to flat. Positive divergence is present.
See today’s economic calendar with a rundown of releases.
THE RANGE OF TUESDAY’S MOTION
Crude Oil Futures (CL_F)
February 29, 2016 Crude Oil futures – Range expansion gave us a reversion to the mean trade for Friday. We now sit at important support this morning – 32.4-32.8 region
Today, the trading ranges for crude oil futures are between 32.04 and 34.04. Expansions outside those zones will retest, and if held will advance in the direction of the break.
Moving averages in oil show us at a decision zone with increasing positive momentum. This generally gives rise to buyers showing up when it seems like the chart will roll. Moving average squeezes are present across a number of time frames.
Intraday long trade setup suggests a long off 33.15 positive retest, or 32.36 bounce into 32.65, 33.03, 33.11, 33.45, 33.75, 34.09, and if buyers hold on, we’ll see 34.4 to potentially 35.23.
Intraday short trade setup suggests a short below a 33.34 failed retest, or off the big bounce into 33.76 (watch the higher low to get out of this short) sends us back through familiar targets to 33.45, 33.23, 32.87, 32.59, 32.35, 32.02
Have a look at the Fibonacci levels marked in the blog for more targets.
E-mini S&P 500 Futures (ES_F)
Below is a S&P 500 futures chart with price support and resistance trading levels for today. Click to enlarge.
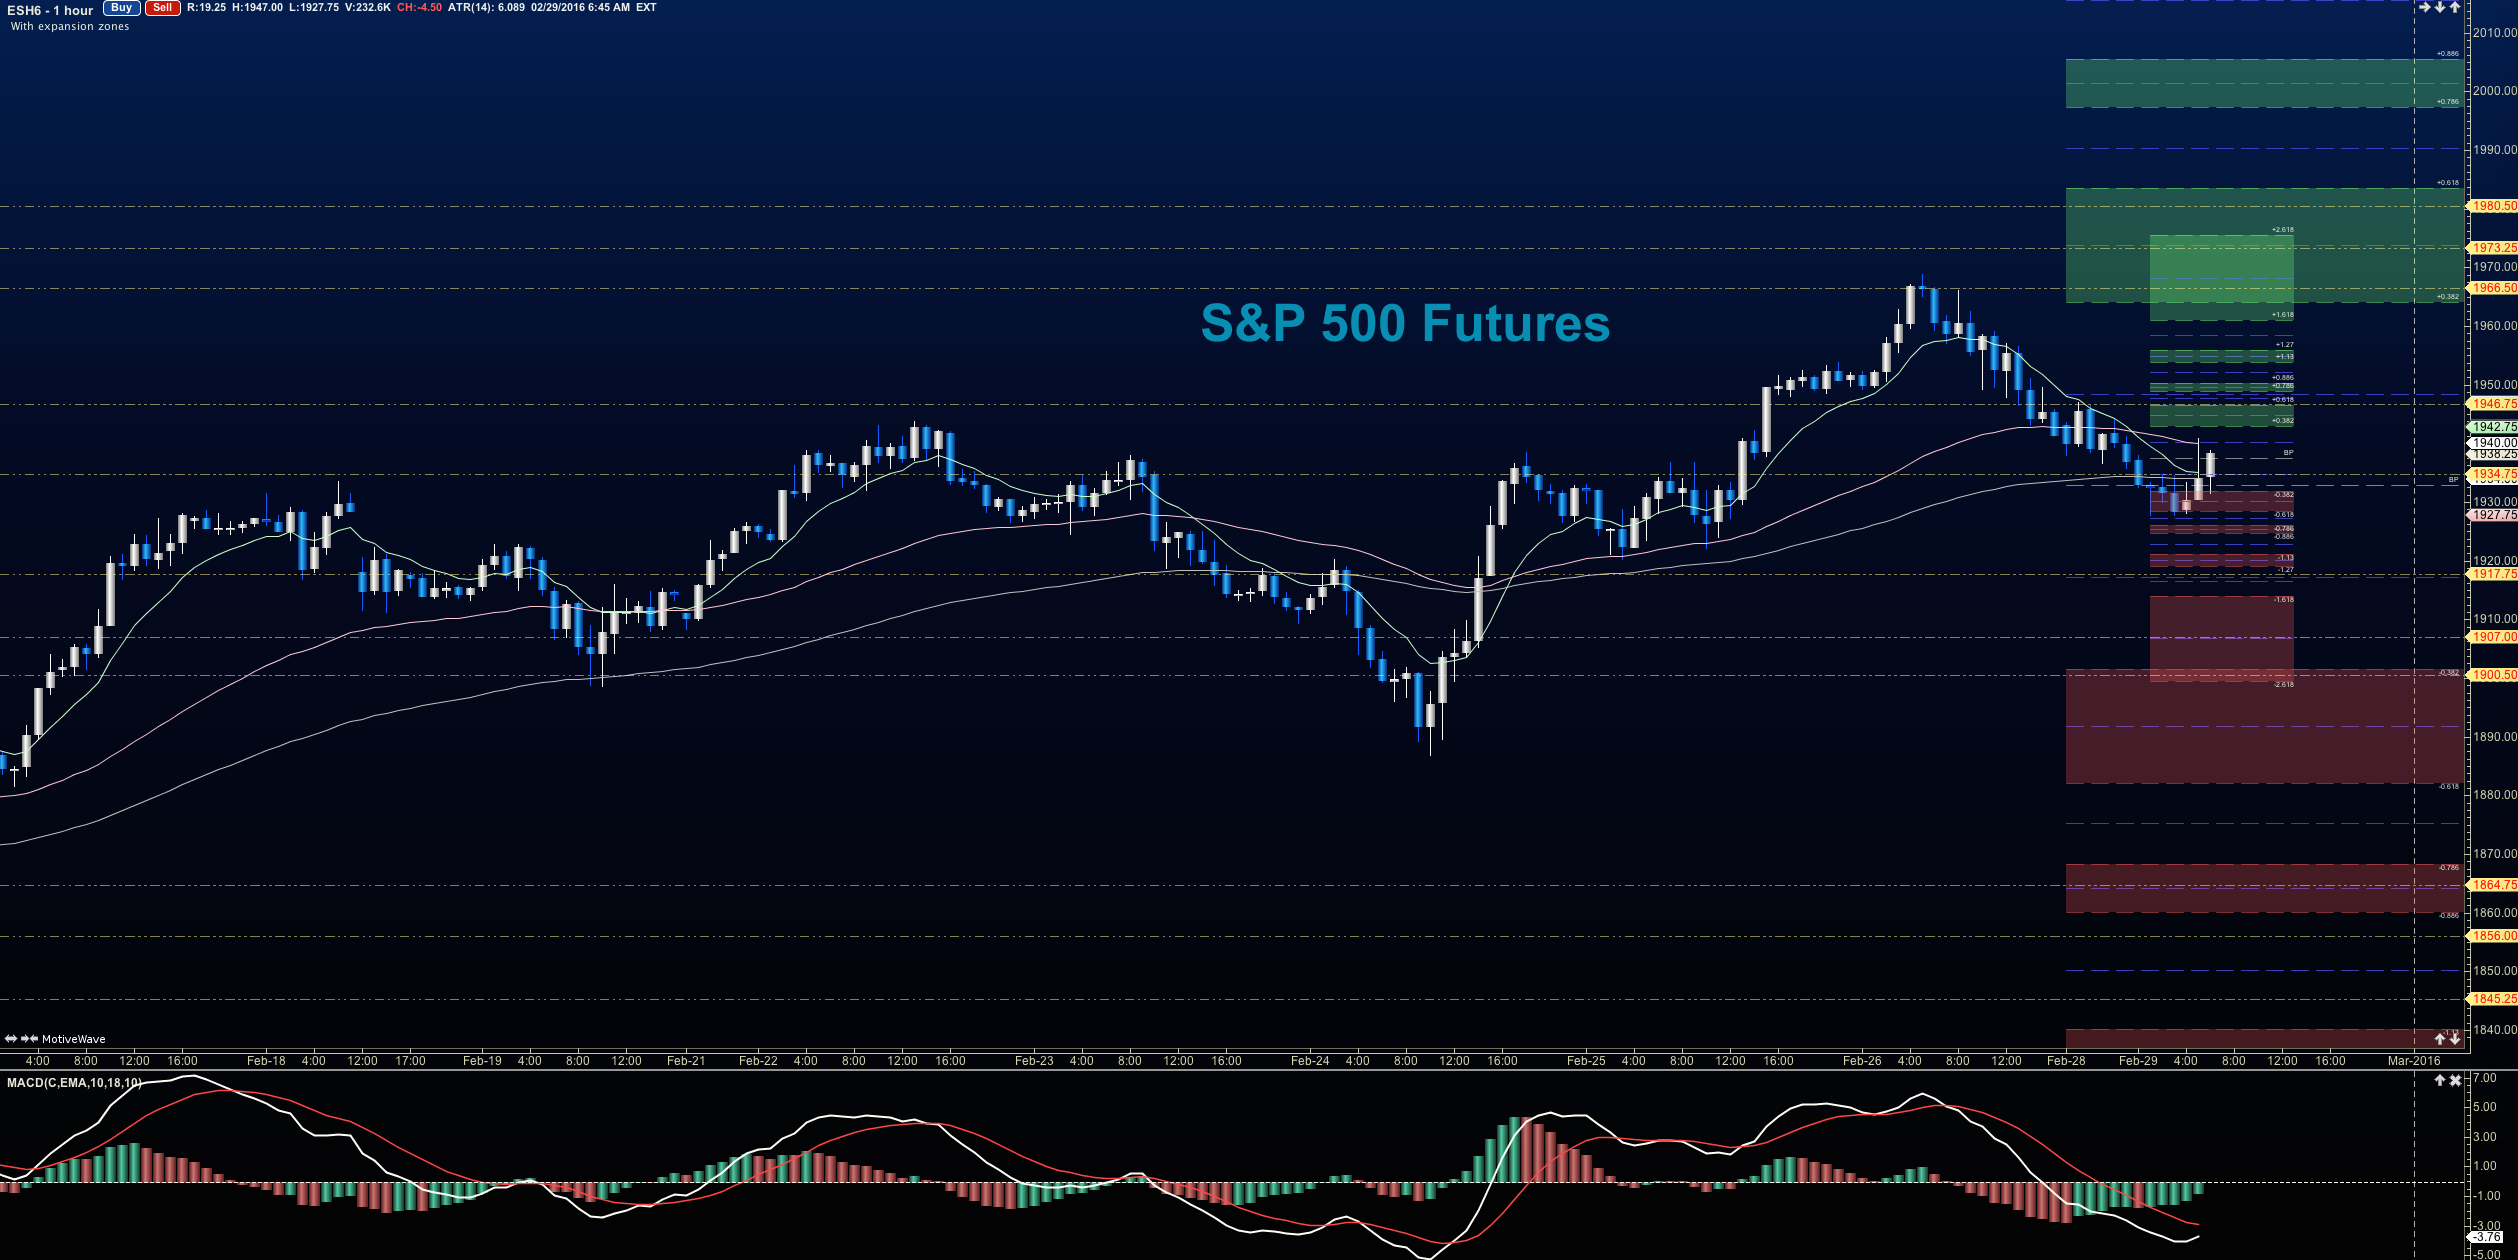
February 29 stock market futures outlook (S&P 500 futures) – We are seeing a pullback from range expansion. The chart should retest prior support regions before continuing.
Upside motion for S&P 500 futures has the best setup on the positive retest of 1929 or a breach and successful retest of 1942.5. I use the 30min to 1hr chart for the breach and retest mechanic. Targets from 1929 are 1932.5, 1935.5, 1941.5, 1944.5, 1948.75, 1951.25, 1954.5, 1958.75, 1961.75 and if we can catch a bid there, we could expand into 1964.5-1974. Big resistance test sits at the region between 1972-1974. Watch the higher lows to keep you on the right side of the long trade. Charts are firming up, but are likely exhausted here so we should see a bit of a sideways patch-keep that long undercurrent in mind, as it still appears on the daily and weekly time frames.
Downside motion opens below the failed retest of 1927.5 or at the failed retest of 1940.75 with negative divergence. Retracement into lower levels from 1940.75 gives us the targets 11934.75, 1929.25, 1922.5, 1918, 1915.75, 1914, and perhaps 1904.75 if selling really takes hold.
Have a look at the Fibonacci levels marked in the blog for more targets.
If you’re interested in the live trading room, it is now primarily futures content, though we do track heavily traded stocks and their likely daily trajectories as well – we begin at 9am with a morning report and likely chart movements along with trade setups for the day.
As long as traders remain aware of support and resistance levels, risk can be very adequately managed to play in either direction as bottom picking remains a behavior pattern that is developing with value buyers and speculative traders.
Twitter: @AnneMarieTrades
The author trades stock market futures every day and may have a position in mentioned securities at the time of publication. Any opinions expressed herein are solely those of the author, and do not in any way represent the views or opinions of any other person or entity.


 Flirting With Critical Support… Again")


