The S&P 500 futures chart has rallied nicely into resistance as expected. However, the S&P 500 futures rally has occurred with little market interruption between 1951 and 1968. That often means retests of supports. Those retests below have begun with 1960.25 as first test and 1951.25 as the next likely test.
The Morning Report: S&P 500 Futures Run Into Major Resistance At 1970
The S&P 500 futures rally could lose some steam quickly as momentum remains weak intraday. That said, strong support seems likely at 1944-1946. I do not expect charts to expand past 1970 and hold – we should see a rejection of any range expansions to the north on first attempt.
Momentum on the four hour chart is sloping positive, and in positive territory – that’s bullish – but only into resistance. And that should restrict the S&P 500 futures rally. Daily charts read momentum as trending mildly positive, and in neutral territory – suggesting support levels will bring buyers to the rescue once more.
Shorter time frame momentum indicators are sitting in positive territory, and sloping up. Negative divergence is present.
See today’s economic calendar with a rundown of releases.
THE RANGE OF TUESDAY’S MOTION
Crude Oil Futures (CL_F)
Crude Oil futures buyers continue to show increased strength, forcing prices higher. But momentum is once again mixed so our range expansions should give way to selling as buyers hold the price action firm below for now.
Today, the trading ranges for crude oil are between 32.57 and 34.54. Expansions outside those zones will retest, and if held will advance in the direction of the break. I suspect range expansion to the north is on the horizon, but I do not expect it to hold in the longer term right now. 32.57-32.7 will be the level to hold for this expansion to continue neatly.
Moving averages on crude oil are still mixed across longer intraday time frames across the board-daily and weekly charts still show primarily negative trend, but with momentum building positive. Moving average squeezes are present across a number of time frames.
Intraday long trading setups in crude oil futures suggest a long off 33.23 positive retest, or 32.6 bounce into 32.78, 33.11, 33.45, 33.75, 34.09, and if buyers hold on, we’ll see 34.4 to potentially 35.23.
Intraday short trading setups suggest a short below a 33.2 failed retest, or off the big bounce into 34.4 (watch the higher low to get out of this short) sends us back through familiar targets to 34.04, 33.78, 33.45, 33.23, 32.87, 32.59, 32.35, 32.02
Have a look at the Fibonacci levels marked in the blog for more targets.
E-mini S&P 500 Futures (ES_F)
Below is a S&P 500 futures chart with price support and resistance trading levels for today. Click to enlarge.
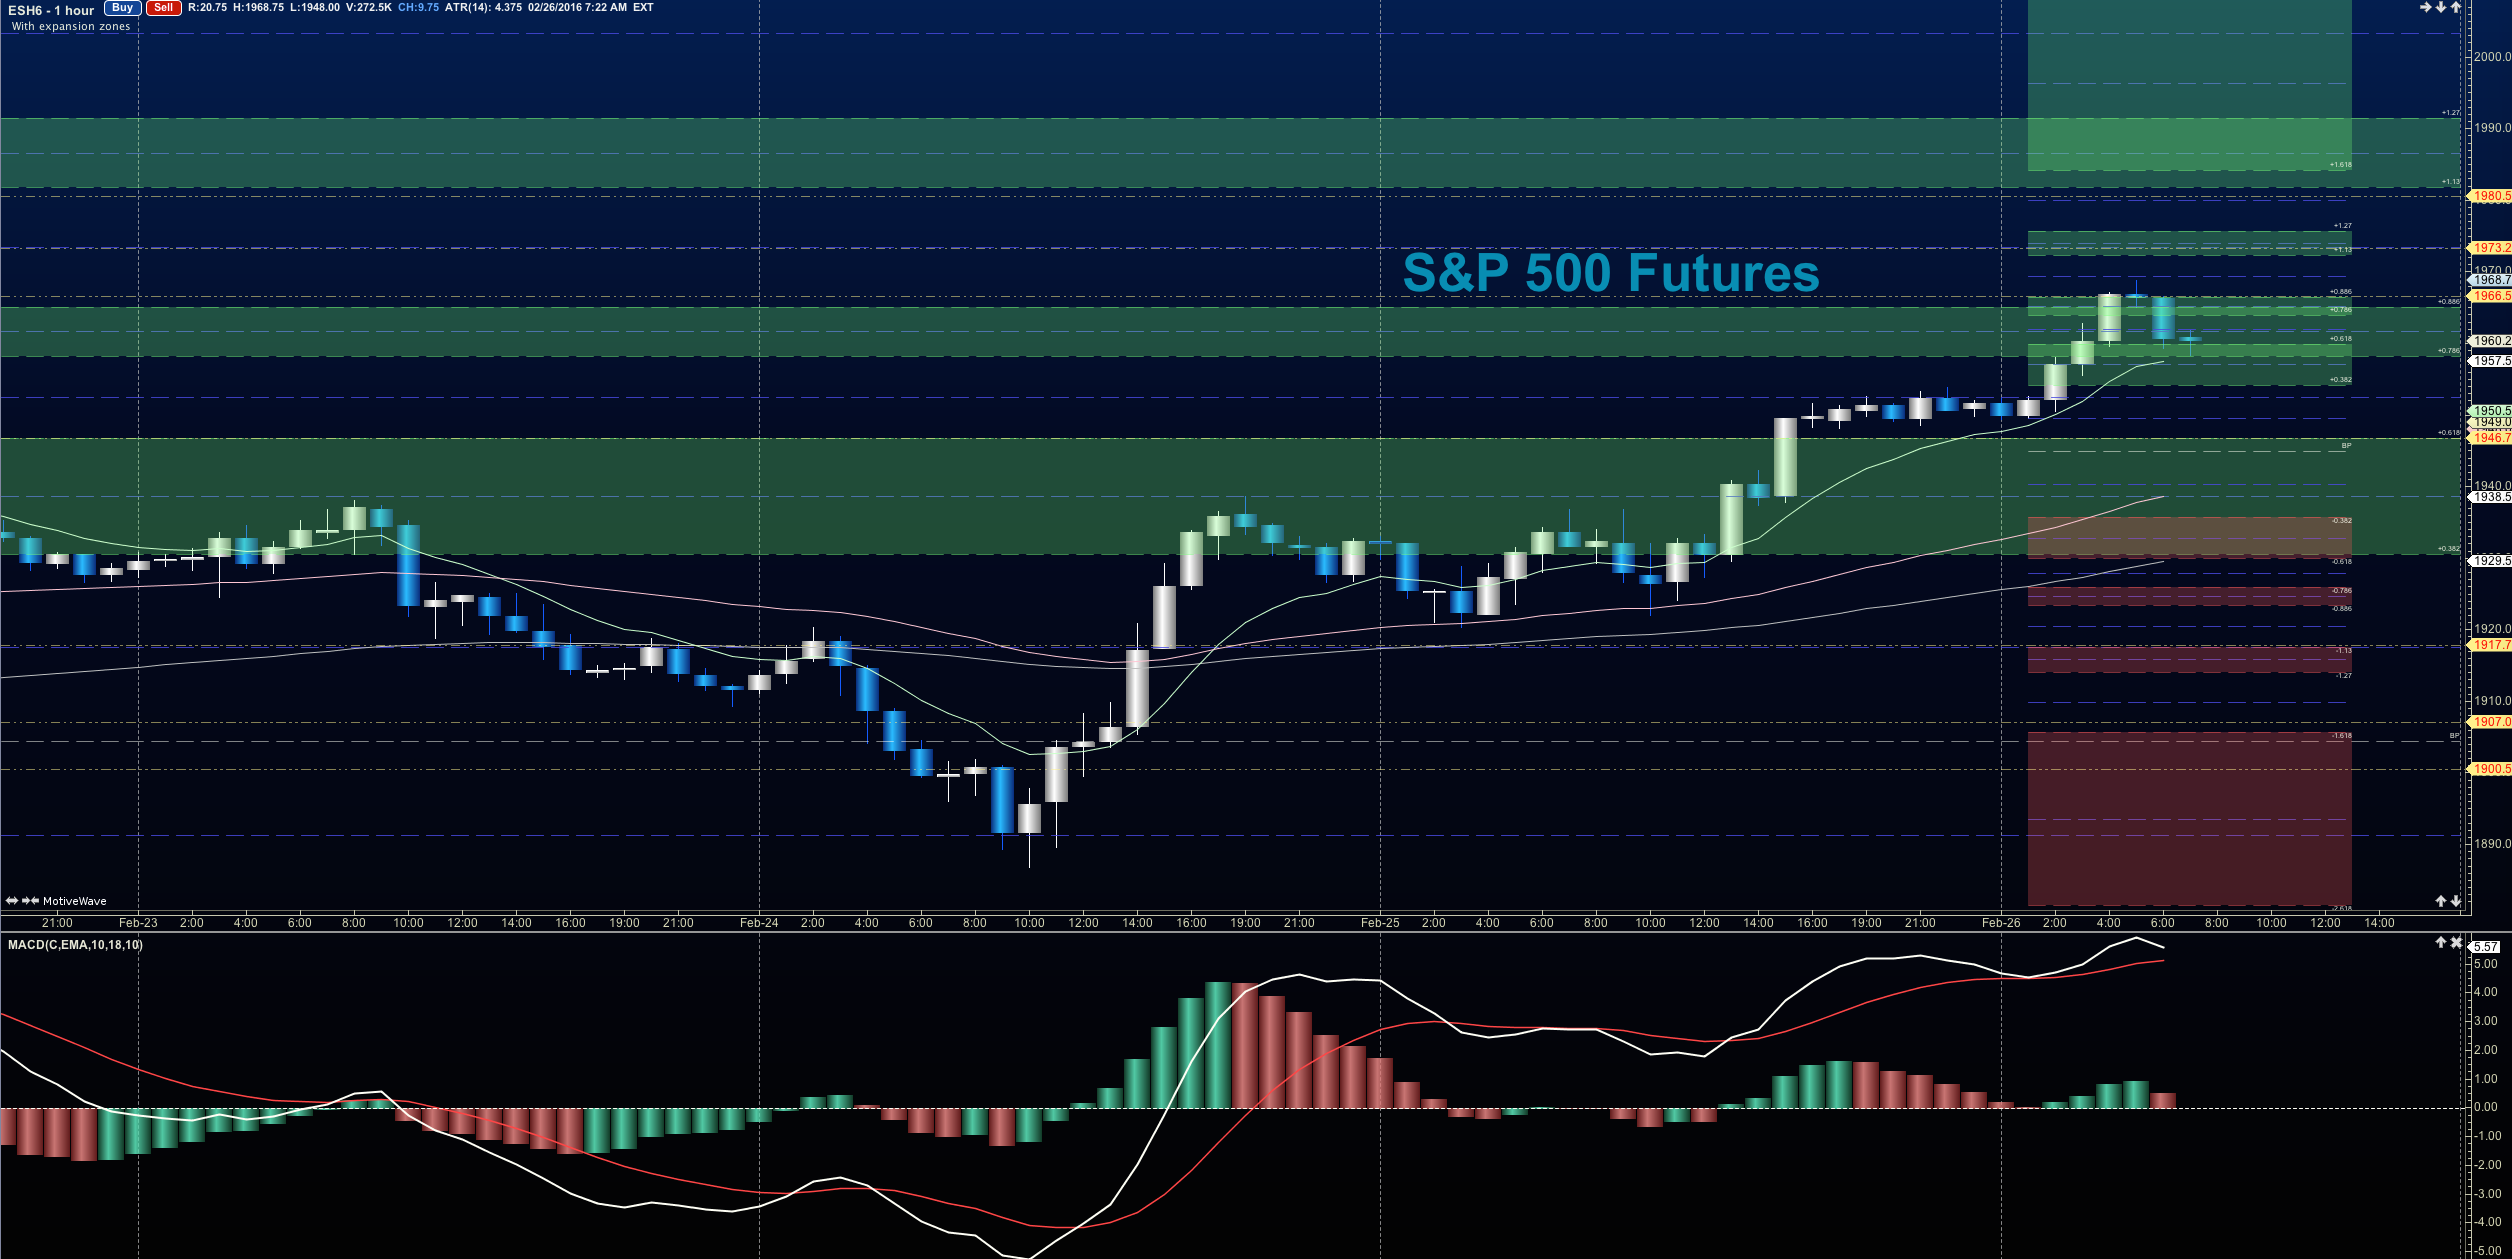
The S&P 500 futures rally has highlighted the bullish price action heading into February 26 (the end of the week). But, as mentioned, clear resistance looms at 1970.5-1972. The S&P 500 futures chart should retest prior support regions before continuing.
Upside motion has the best setup on the positive retest of 1952 or a breach and successful retest of 1964.5. I use the 30min to 1hr chart for the breach and retest mechanic. Targets from 1952 are 1954.5 1958.75, 1961.75, 1964.5, 1968.5, 1970.5 and if we can catch a bid there, we could expand into 1972-1974. Big resistance test sits at the region between 1972-1974. Watch the higher lows to keep you on the right side of the long trade. Charts are firming up, but are likely exhausted after the strong S&P 500 futures rally, so we should see a bit of a sideways patch. Keep that long undercurrent in mind, as it still appears on the daily and weekly time frames.
Downside motion opens below the failed retest of 1952.5 or at the failed retest of 1964.5 with negative divergence. Retracement into lower levels from 1964.5 gives us the targets 1960.5, 1957.75, 1954.25, 1951.5, 1946.25, and perhaps 1943.75 if selling really takes hold.
Have a look at the Fibonacci levels marked in the blog for more targets.
If you’re interested in the live trading room, it is now primarily futures content, though we do track heavily traded stocks and their likely daily trajectories as well – we begin at 9am with a morning report and likely chart movements along with trade setups for the day.
As long as traders remain aware of support and resistance levels, risk can be very adequately managed to play in either direction as bottom picking remains a behavior pattern that is developing with value buyers and speculative traders.
Twitter: @AnneMarieTrades
The author trades stock market futures every day and may have a position in mentioned securities at the time of publication. Any opinions expressed herein are solely those of the author, and do not in any way represent the views or opinions of any other person or entity.


