There is a healthy debate between those who work in fixed-income markets and those in the equity markets about who is better at assessing markets.
The skepticism of bond guys and gals seems to help them identify turning points. The optimism of equity pros lends to catching the full run of a rally.
As an ex-bond trader, I have a hunch but refuse to risk offending our equity-oriented clients by disclosing it. In all seriousness, both professions require similar skill sets to determine an asset’s fair value with the appropriate acknowledgement of inherent risks. More often than not, bond traders and stock traders are on the same page with regard to the economic outlook. However, when they disagree, it is important to take notice.
We created the Trump Range Chart a few months ago to easily track a number of asset classes, gauge the durability of post-election market moves and monitor divergences. In the May 23, 2017 update to that chart, we noted that some indicators such as the Treasury yield curve, regressed to levels observed prior to the election. At the same time, many of the popular equity indexes continue to power ahead to new record highs. The bond market seems to be telling us that the probabilities of the reflation trade have dropped considerably. Meanwhile, the stock market appears to remain convinced that the prospects for growth and reflation are alive and well. Can they both be right?
Given our opinions on the severe economic headwinds facing economic growth and steep equity valuations, we believe this divergence poses a potential warning for equity holders. Accordingly, we thought it appropriate to provide a few graphs to demonstrate the “smarter” guys are not on board the growth and reflation train.
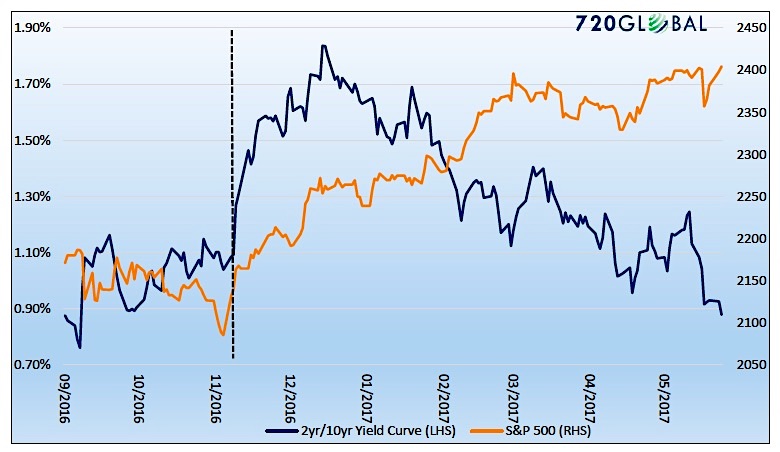
The graph below shows that the U.S. Treasury 2-year/10-year curve which, having gapped almost 75 basis points wider following the election, has reverted back to pre-election levels. Alongside the yield curve is the S&P 500 (INDEXSP:.INX), which continues reaching new highs since the election. The election date in this graph, and all graphs that follow, is highlighted with the vertical dashed line. Data for the graphs courtesy of Bloomberg and the St. Louis Federal Reserve (FRED)
The U.S. Treasury yield curve has been a reliable predictor of recessions in the past. As shown below, the popular 2-year/10-year U.S. Treasury yield curve spread has inverted prior to all recessions (gray bars) since at least 1980.
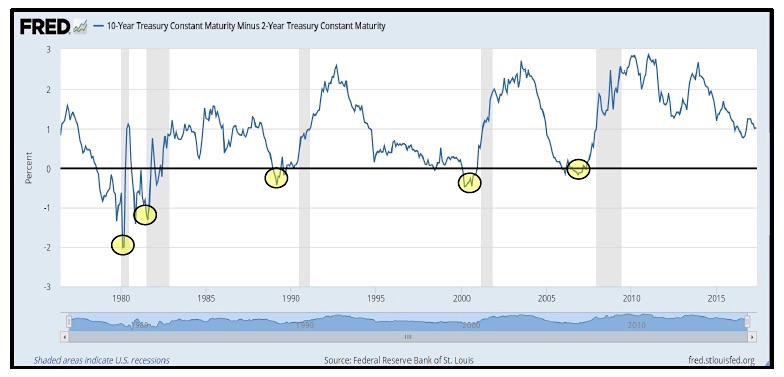
Currently the yield curve is not close to inverting, but the flattening trend is quite the opposite of what one would expect if bond traders and investors were expecting a boost to economic growth and higher inflation.
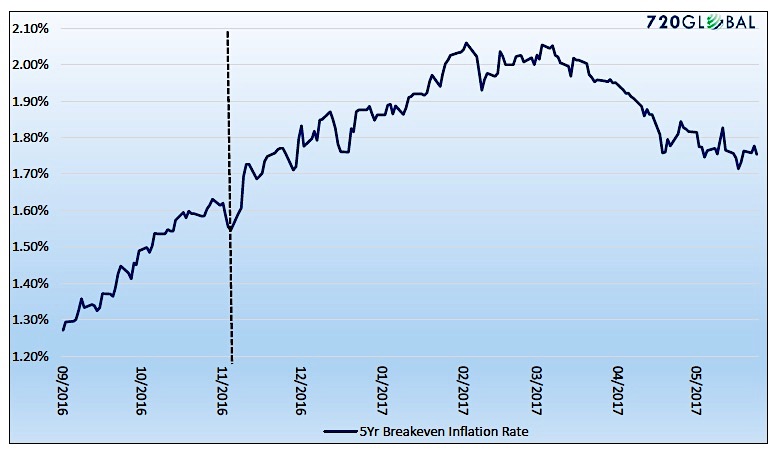
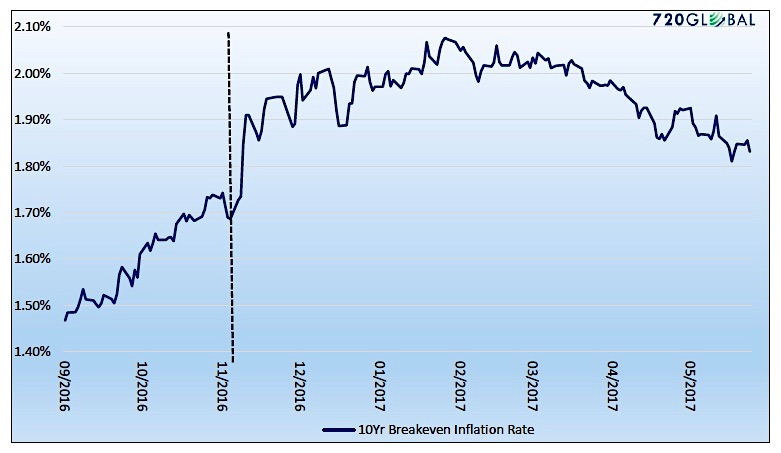
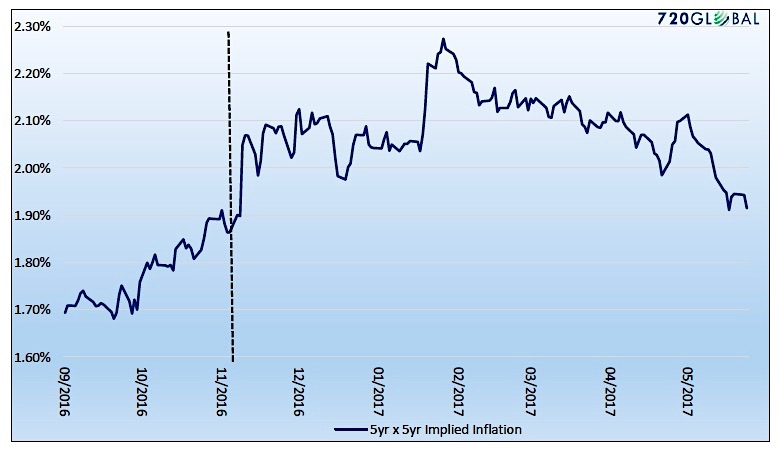
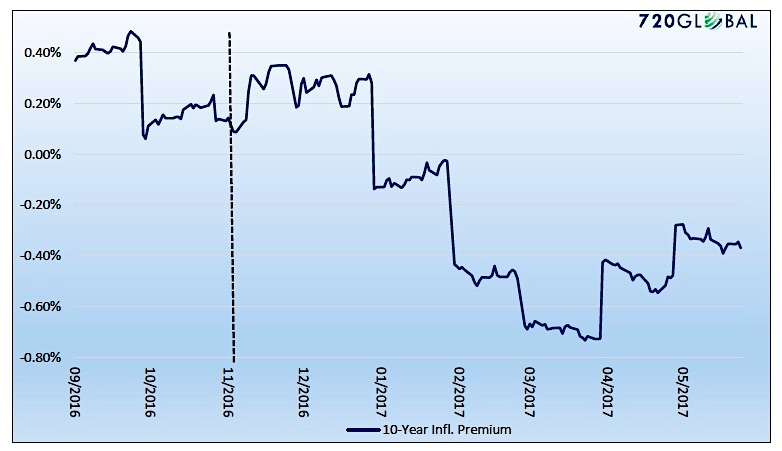
The following graphs reflect the deteriorating economic expectations implied by bond markets as juxtaposed by the persistence of the equity markets.
5-Year Breakeven Inflation Rate: Measures market-based inflation expectations over the next five years.
10-Year Breakeven Inflation Rate: Measures market-based inflation expectations over the next ten years.
5-Year x 5-Year Implied Inflation: Measures market-based 5-year inflation expectations in 5 years (e.g. inflation in the years 2022-2026).
Inflation Premium: Measures the 10-year yield premium (discount) that investors require over the rate of inflation.
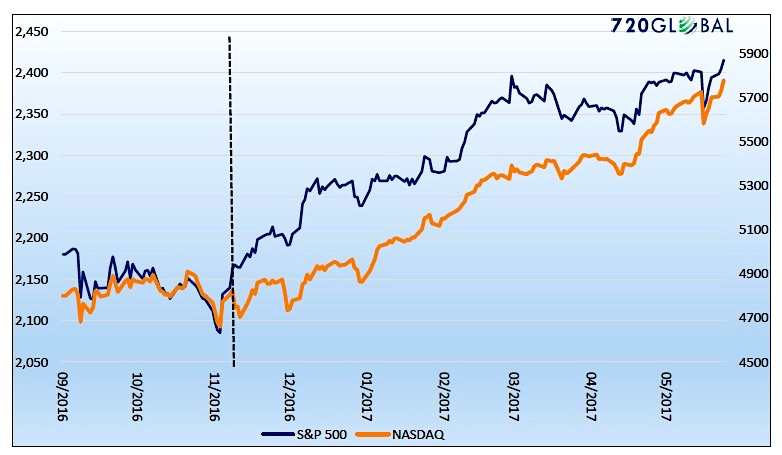
S&P 500 and NASDAQ Equity Markets
Summary
Given the divergences shown between bond and equity markets, logic says somebody’s wrong. Another possibility is that neither market is sending completely accurate signals about the future state of the economy and inflation. It is clear that bond traders do not buy into this latest growth narrative. Conversely, equity investors are buying the growth and reflation narrative lock, stock and barrel. To be blunt, with global central banks buying both bonds and stocks, the integrity of the playing field as well as normally reliable barometers of market conditions are compromised.
This divergence between bond and equity traders could prove meaningless, or it may be a prescient warning for one or both of these markets. Either way, investors should be aware of the divergence as such a wide gap in economic opinions is unusual and may portend increased volatility in one or both markets.
Get more research insights as well as information on our premium service “The Unseen” over at our website 720Global.
Thanks for reading.
Twitter: @michaellebowitz
Any opinions expressed herein are solely those of the author, and do not in any way represent the views or opinions of any other person or entity.

: Showing Some Signs of Emerging Strength")
