Key Stock Market Takeaways:
The S&P 500 Index INDEXSP: .INX is bouncing off its recent lows, though evidence of a renewed uptrend is lacking. Investor sentiment surveys show a big build in investor pessimism, though longer-term studies still show more complacency than fear. Low bond yields and stock market nervousness are supporting strength in Gold NYSEARCA: GLD.
After posting their worst decline of 2019 last week, stocks have remained volatile this week.
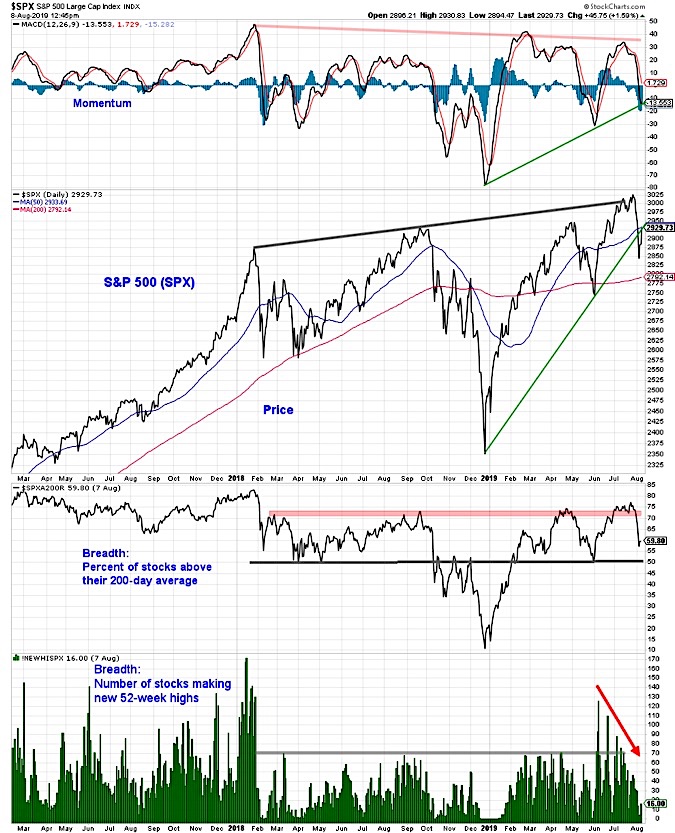
At its mid-day low on Monday, the S&P 500 was more than 200 points (more than 7%) below the all-time high reached less than two weeks ago (July 26).
Price was following deteriorating momentum trends at both the index and sector-level. Once again, investors were able to add or reduce exposure to the S&P 500 at a level that was first reached 18 months ago.
Selling has since ebbed and the S&P 500 has (as of this writing) recovered all of its early-week losses.
From both a price and percentage of stocks above their 200-day averages, the S&P 500 remained above the late-May/early-June lows. Holding those levels going forward will help support the view that the current pullback has been a pause within an ongoing up-trend off of the December lows.
Lower lows from either a price perspective or the percentage of stocks above their 200-day averages would be a challenge to that trend. If stocks are able to rally, a meaningful expansion in the new high list would be encouraging evidence that the up-trend is intact. While the bounce so far has been encouraging, it may require a period of consolidation before a meaningful reassertion of the uptrend emerges.
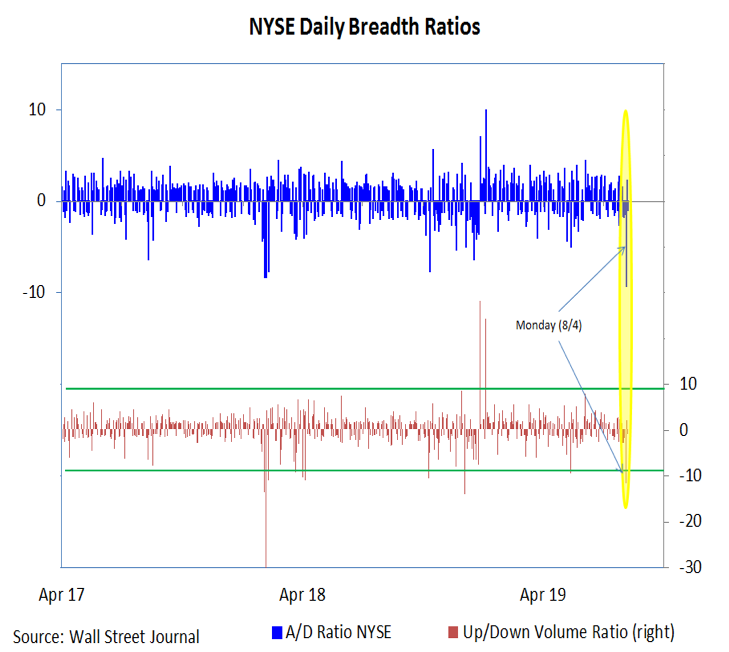
By some measures, Monday’s selling was excessive. Based on NYSE data, declining issues outnumber advancing issues by more than 9 to 1, the most since 2016, while the 494 stocks that were down on the S&P 500 was the most since the worst of the December decline. From a volume perspective, Monday’s weakness showed 12:1 tilt toward downside volume on the NYSE. Data from NDR that looks at just equities showed at 44:1 downside tilt, the most since February 2018.
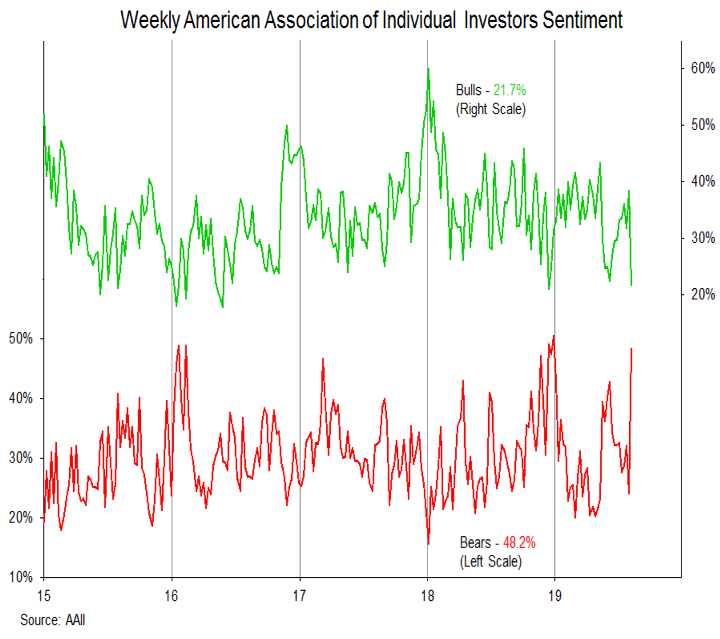
By some measures, investor sentiment has reacted quickly to this recent bout of stock market weakness. Data from AAII showed the percentage of bullish respondents dropping from 38% to 22%, while the percentage of bears doubled to 48%. Interestingly, this was accompanied by a surge in survey responses.
In other words, the decline in stocks may not have flipped investors from bullish to bearish as much as it brought latent bears out of the woodwork. It confirmed their bearish bias, and made it more comfortable to express that view. The NAAIM Exposure Index saw a similar reaction, falling from 91% to 57%, for the largest weekly decline since 2013. Most of the decline was attributable to those in the bearish half of the distribution becoming more bearish.
Those sentiment indicators can help provide evidence that investor attitudes have become too bullish or bearish from a short-term perspective. These shifts occur within the context of a longer-term trend that has flattened out and a market that has struggled to maintain rallies for more than 18 months. One reason for that may be the level of complacency that is revealed by considering how investors are exposed, not by just by how they claim to feel.
Looking at aggregate exposure across all mutual funds and ETFs shows historically high exposure to equities and historically low exposure to cash. While weekly flow day measures asset movements in billions, this data reflects asset allocation in the trillions.
Ongoing volatility in stocks and the recent drop in bond yields has helped strengthen Gold, which has broken out to its highest level in six years.
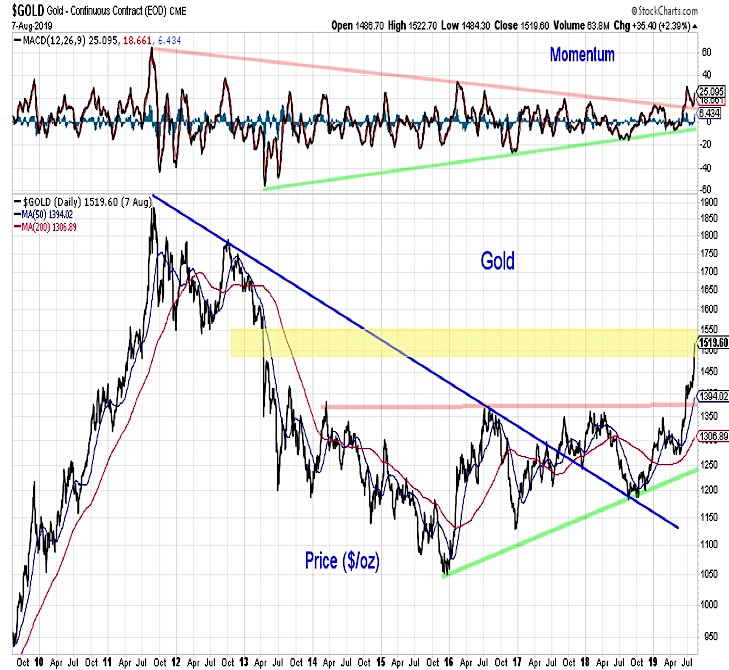
Historically gold has done the best in periods of negative real interest rates so declining bond yields have been seen as a tailwind. While price and momentum trends are breaking out to the upside, sentiment for gold has reached the excessive optimism level. This comes as gold moves into a resistance zone between 1500-1550. With macro uncertainties remaining elevated (see this week’s Macro Update), gold could continue to enjoy a tailwind even if some near-term consolidation is seen.
Twitter: @WillieDelwiche
Any opinions expressed herein are solely those of the author, and do not in any way represent the views or opinions of any other person or entity.


