By Andrew Kassen Pop quiz: When did the European debt crisis begin?
- May 8, 1945: Germany unconditionally surrenders during World War II (VE Day)
- Late 1989: The Berlin Wall falls
- October 1990: West and East Germany are Reunified
- February 7, 1992: The Maastricht Treaty is signed
- January 1, 1999: The Euro begins trading
Give up (by the way: welcome back to 10th grade World History!)? In fact, that’s a bit of a trick question: there’s no single answer. Unsurprisingly, reality is just a bit more complicated than what fits neatly in multiple choice.
It’s fair – if more puzzling – to say the Eurozone and “the single currency” circulating among its 17 members was multiple decades in the making, and that these milestones and others are seminal events that sewed the seeds of the Eurozone’s current turmoil.
Even the most casual follower of the Euro saga know it’s a complex history that hasn’t become any simpler over the past few years.
So let’s cast our net a little more narrowly: when did the European debt crisis really begin in earnest? That’s easier: Late 2009, when Greece was first subjected to serial downgrades of its sovereign debt.
Without a doubt, that is the period when the Eurozone periphery’s (typified by Greece) slow burn of suffering bubbled over into popular discourse and elicited its first major response in global markets.
Since that time, the Euro (here we’ll look at EUR/USD) has installed some dramatic moves, outfitting a currency bloc that wrestled in the throes of solving what may yet prove insoluble: reconcilation of a single monetary policy with the disparate cultures, economies and fiscal policies of 17 countries.
Against that backdrop, some may be surprised that in the 3.5 years from here to there the Euro has only weakened by 1800 pips (-12%) against the US Dollar:
EUR/USD – Weekly: 2008-2013 (click image to zoom):
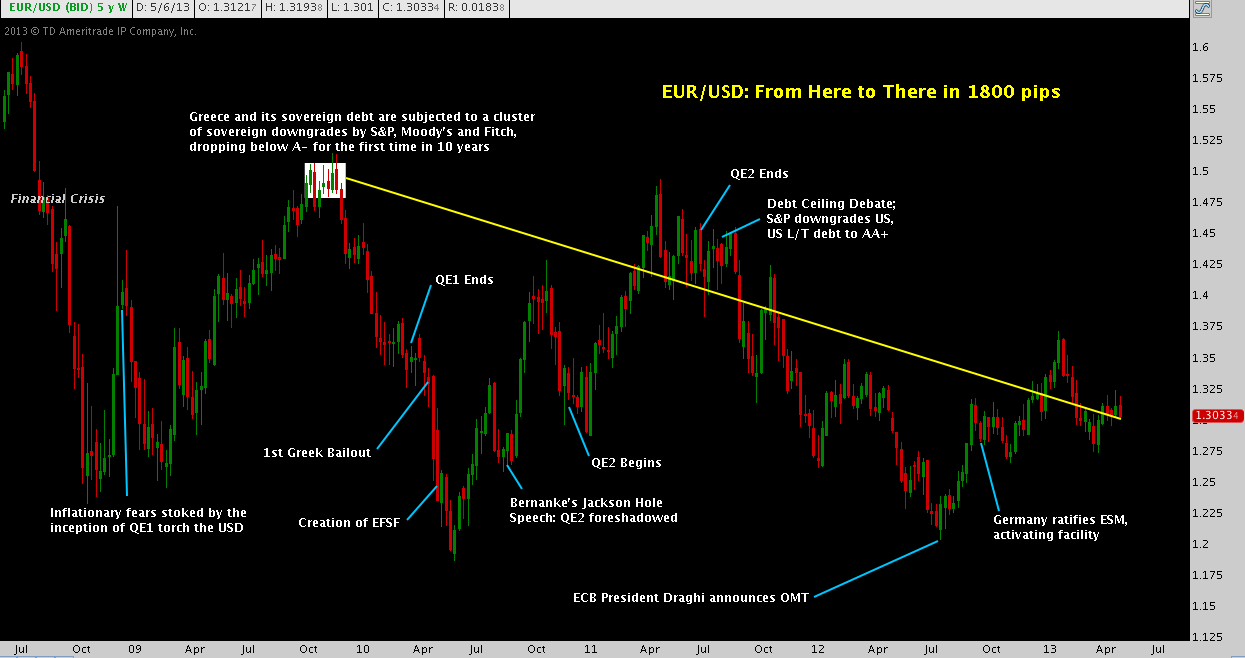
How the Eurozone got to this point is a voluminous, tragic, wonky and often unintentionally hilarious tale. It’s a paintfully strange backstory that’s been told masterfully – to death – elsewhere, so we won’t talk about much of it here. But let’s note the following: fast forwarding through 2.5 years of exposition, we arrive at last Summer, wherein ECB President Draghi introduces the “fully effective backstop” otherwise known as OMT to the world in July. Shortly afterward, Germany ratifies the all-sufficient (with leverage!) ESM bailout facility in the Fall. As a result, peripheral sovereign debt yields – namely Spain and Italy – have decline precipitously. From the day Draghi swore to do “whatever it takes” to protect the Euro last July through the end of January, EUR/USD strengthened nearly 1700 pips, from 1.2041 to as high as 1.3710. Yes, they call him Super Mario for a reason.
That brings us to the present, where the Euro Crisis seems to have entered a new phase: one of almost self-parody as its bureaucratic institutions bravely convey mastery over the Eurozone’s problems (even winning the Nobel Peace Prize for their efforts) but never ceasing to breathlessly careen from one novel crisis to the next. With some abridgement of the full list: there’s the strange tale of the stumbling Cypriot bailout; headlines today that Slovenia should avoid a bailout, catastrophic unemployment in Club Med countries; Franco-German political tensions; flagging industrial production in the Eurozone core; German disinflation; and just last week the ECB slashing rates with Draghi affirming the central bank is “ready to act”, even if that means negative deposit rates.
So the Euro crisis appears to be on the mend, then? That’s the message of optimism Germany’s key equity index DAX and Eurozone blue chip benchmark EUROSTOXX50 seem to convey as they press to further all-time highs day-by-day. And the result for EUR/USD? Net -700 pips since the end of January to just above 1.30.
The Euro currency itself is widely perceived as behaving with remarkable resilience throughout all of this, often with a mix of disbelief and even some occasional sneering thrown in. If by some token of luck you haven’t come across some variation of “this monetary abomination is not back to parity with the dollar yet”, trust me: it won’t be long.
But on balance, one must concede the EUR/USD can’t seem to get up off the floor either. Despite the Troika’s firm assurances the Euro project will not be allowed to fail, EUR/USD has been failed on every attempt over the last 18 months to break and hold above 1.35. So even if this litany of recurrent and emergent problems doesn’t add up to another leg of the Euro crisis (as we noted, European equities seems quite convinced otherwise) it may yet function as the catalyst that pushes the Euro itself into crisis.
Turning to some technicals: one way this may play out that is – or soon will be if the pair breaks below 1.28 – top of mind for every trader and active investor in Forex is the massive Head & Shoulders Top (outlined in blue) that seems to be setting up on EUR/USD:
EUR/USD – Daily: July 2012-May 2013 (click image to zoom):
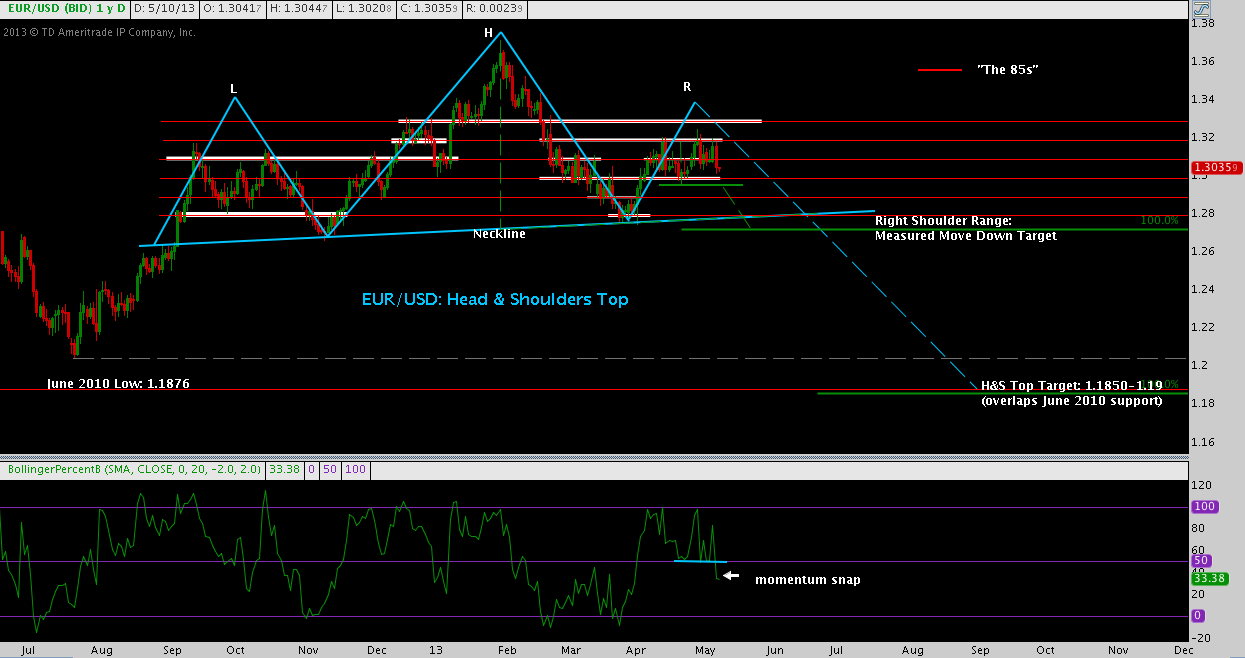
What could possibly cause a drop from above 1.30 to 1.18? After all, hasn’t the Euro Crisis and the Euro itself turned a corner? To the first question: I don’t pretend to know; and to the second: if the ECB is willing to share its contemplation of negative rates, the Euro may be on a path much, much lower. However incredible it may seem, a much lower EUR/USD in the near future is technical plausible.
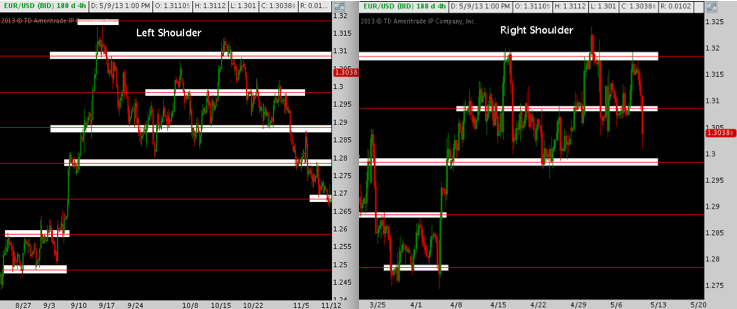
First, check out the similarities in Left and Right shoulder structure, with both featuring a 5-6 week, 200-300 pip congestion zone. As assessment of classical chart patterns goes, this kind of symmetry on a relatively wide timeframe is both uncommon and desirable:
EUR/USD – 4-Hour: Left and Right Shoulders (click image to zoom):
Price has not yet broken down below late April support near 1.2985 to really build out the right shoulder. If that level does break (as the momentum floor broken on Percent B in the chart above suggests it might), the range itself calls for a measured move down where it runs into the H&S Top neckline, comprised of mid-November 2012 and late March/early April support in the 1.27 handle.
In short, like any other trade thesis this H&S top (if it even activates with a break below 1.28) will unfurl in steps: watch first for a drop below 1.2985-1.30. If that level goes, I will assume continuation toward the 1.28 support that preceded the right shoulder as long as 1.30 isn’t retaken. At that point, the Head & Shoulders neckline becomes the technical focal point; and as I said before, traders will be well apprised of the implications of that level failing, if they aren’t already. By “implications” I’m referring to a potential Euro crisis: specifically, the sheer 1200 pip technical face with few meaningful footholds down to the canyon floor below 1.20. As a result, absent a significant macro event that would effortlessly cut through that area – assuming EUR/USD makes it below 1.2985 to begin with – I expect another rigorous defense of 1.2750-1.28.
Twitter: @andrewunknown and @seeitmarket
Author holds no position in any securities mentioned at the time of publication.
Any opinions expressed herein are solely those of the author, and do not in any way represent the views or opinions of any other person or entity.
: Worrisome to Broader Market?")

: Important Breakout Retest")