If you’ve seen our recent posts about the Japanese Yen ETF and the Dollar Index, you know we’re watching for a significant reversal in currencies later this year. Sooner than that, we expect some smaller pullbacks in the major currency pairs that will prompt traders to manage their positions or look for countertrend trades.
This week we’re focusing on the Invesco CurrencyShares Euro Trust ETF, NYSEARCA: FXE, which has put in a strong decline since last June. Note that our May 2021 forecast for FXE predicted just such a move.
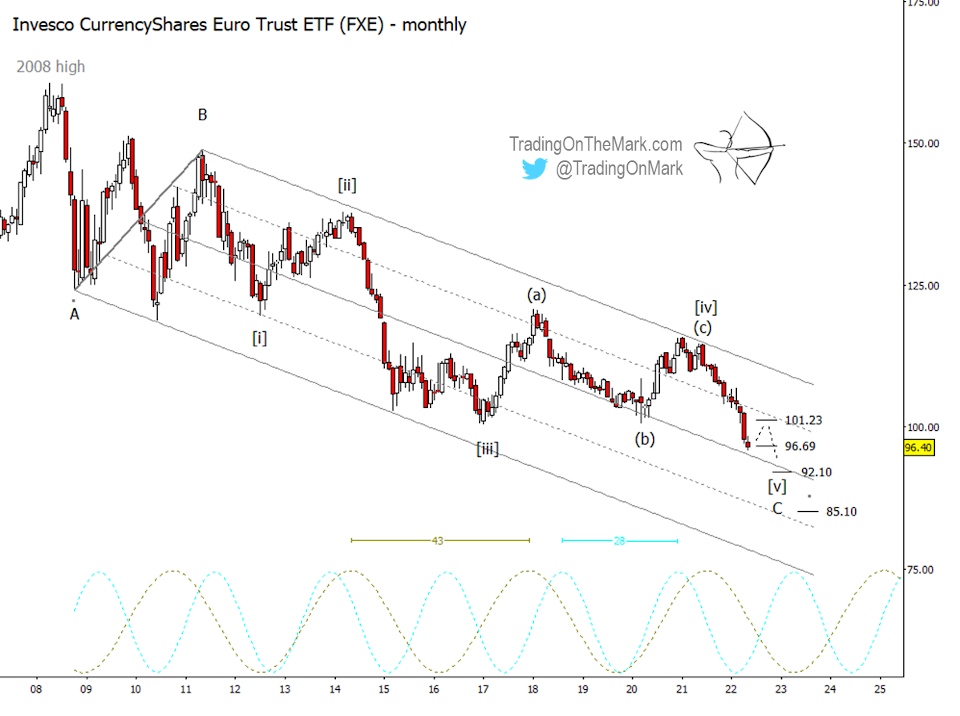
Last year’s reversal really highlighted how useful that long-term channel on the monthly chart has been. However its value is mostly in the past now, as we believe the large downward pattern from the 2008 high is nearing completion.
It’s unlikely that the bottom of the channel will be tested again, but some big-picture supports sit at 96.69, 92.10 and 85.10. Note that price is pushing on the highest of those levels right now. If a small upward pullback occurs, previous support at 101.23 is the most likely place to look for new resistance on a monthly time frame.
We think another minor low is possible later this year, and the Elliott wave count for that forecast is easier to see on a weekly chart.
The decline from the top of the channel should consist of five waves. It’s always difficult to count a pattern while it’s still developing, but we view the idea of a truncated count in the previous segment and the idea of a very shallow wave (ii) retrace in the current segment as being in agreement. The market was in a hurry to move back downward.
The price action coming down from the small wave we have labeled as (ii) looks nearly complete, leading us to expect a minor but possibly tradable (and risky) bounce nearby. For those trading on weekly time frames or slower, this is better viewed as an opportunity to take profits or manage existing positions.
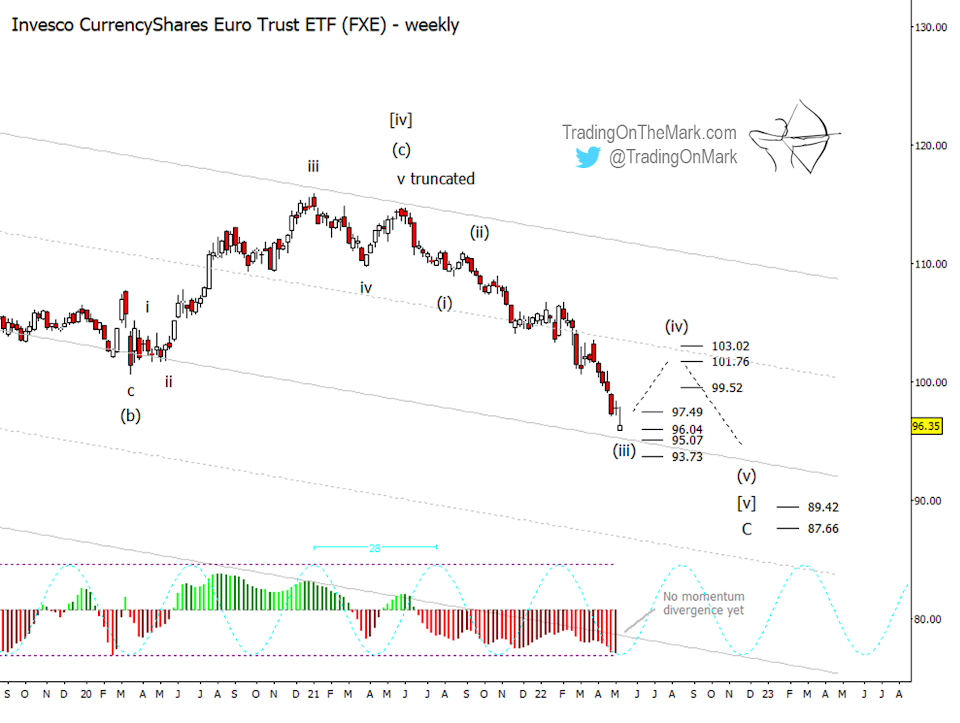
In addition to the center line of the big channel, there are various types of Fibonacci-based supports nearby at 97.49, 96.04, 95.07 and 93.73. This would be a good place for downward wave (iii) to find support.
Another cluster of important levels waits above at 99.52, 101.76 and 103.02. An ideal fourth wave should push into that area and then probably waste time going sideways until autumn.
Some lower targets that could represent support for wave (v) of [v] of ‘C’ await at 89.42 and 87.66, but we don’t think they’ll be tested until later in the year or possibly early in 2023.
On a monthly chart, the 43-month cycle appears to be the more influential one, and it suggests a low soon after the turn of the year. On a weekly chart, the ideal low of the 28-week cycle is in November. There’s also a rule of thumb that major currency reversals are more likely at the turn of the year.
We don’t yet see a reversal signal from the momentum indicator on a weekly chart, although there is such a signal developing on a daily chart.
Let our Elliott wave analysis give you confidence in your trading. Visit Trading On The Mark and follow us on Twitter.
Twitter: @TradingOnMark
The authors may have a position in the mentioned securities at the time of publication. Any opinions expressed herein are solely those of the author, and do not in any way represent the views or opinions of any other person or entity.

: Worrisome to Broader Market?")
