Every significant decline kindles the spirit of catching the bottom. It is a ‘demon’ that every investor, professional or private, seeks to control in order to avoid being caught long in the final washout. Enter the rise and fall of crude oil.
Since mid-2014 Crude Oil (WTI) has been the leading magnet for bottom pickers, but well defined price support levels and fundamental reasoning have failed to arrest the decline. However, the plunge in oil prices below the 2009 low and ensuing price action has caught my attention from technical perspective. And it MAY be time to consider a bottom.
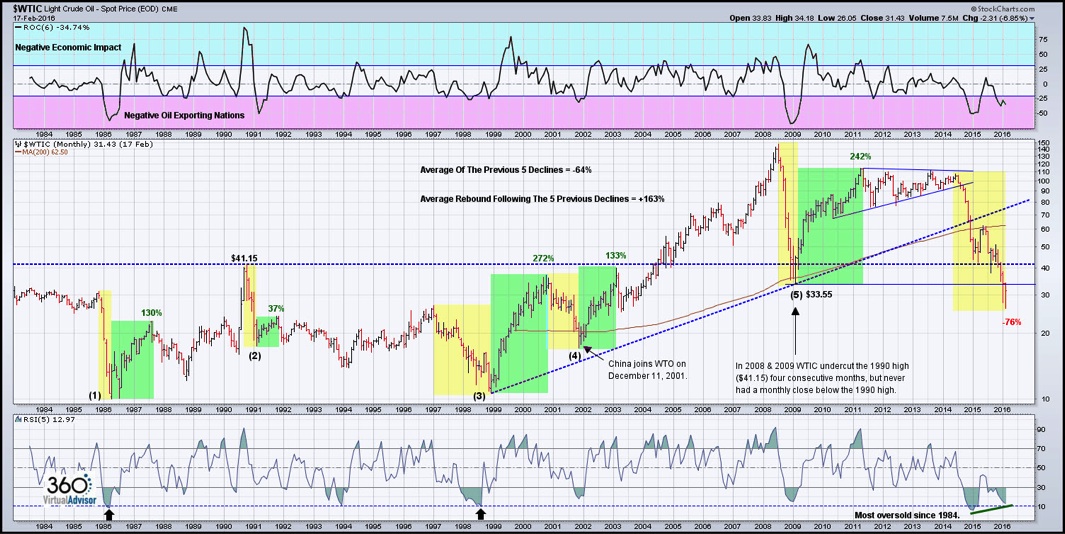
Since mid-2014 WTI crude oil has declined -76%. That is not a correction or a bear market, but a depression. To use a daily or weekly chart fails to encapsulate the magnitude of the decline. Only a monthly chart provides the complete narrative for the oil.
When secular bull markets break they often find support at or around the 200-month moving average. In the case of WTI the commodity is 50% below the long-term moving average. Outside of the Bloomberg Industrial Metals Sub-index most of the individual commodities have found support around the 200-month moving average, such as Wheat, Corn, Silver and Copper.
From a short-term technical perspective, if WTI can recover the 2009 low at the close of February, like in January, it would be the first tell that the commodity has put in at least an intermediate term bottom. A failure to do so would leave the narrative open to another price low.
If February has a strong close the next key resistance level for a rebound in crude oil prices is $41.15. An impulsive breakout above that price level would raise the odds of a rally to $50 and potentially the 200-month moving average at $62.50. click to enlarge charts
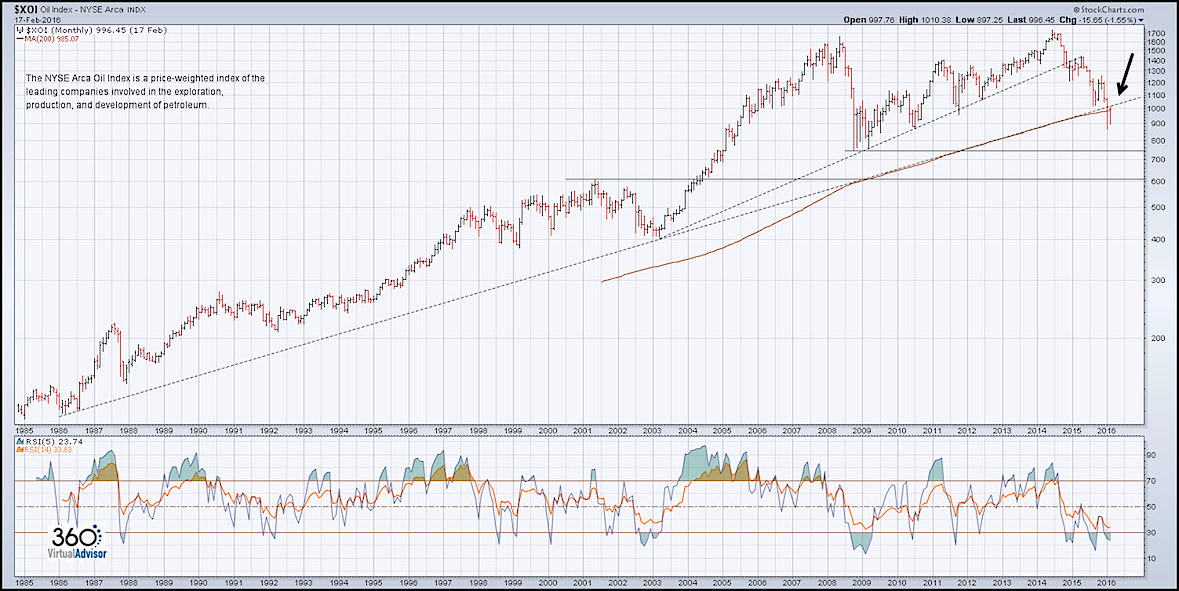
As with WTI, oil companies have suffered a major decline, taking the NYSE ARCA Oil Index (XOI) to near the 200-month moving average. I prefer to use the XOI, because it is the broadest representation of the oil sector and has the longest price history.
Currently the XOI is set to close February with consecutive shake-outs below the 200-month moving average. The ideal bullish scenario for the oil sector is to close this month above the moving average and the macro trendline beginning in 1986.
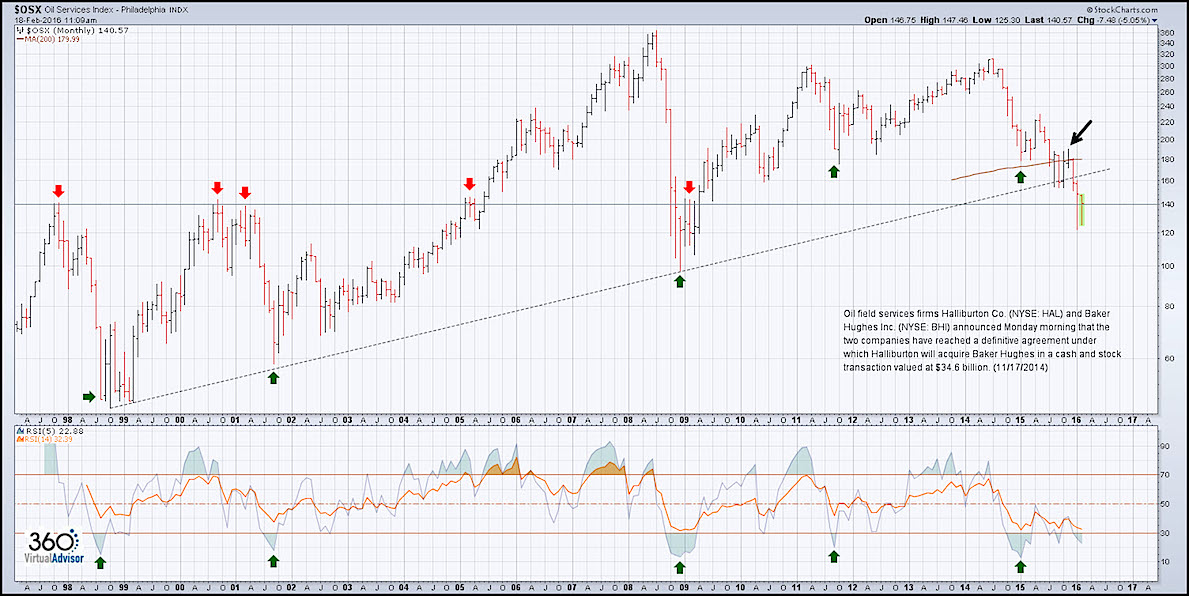
It is a more extreme technical narrative for the Oil Services Index (OSX) industry group versus the overall oil sector as it dropped 30% below the 200-month moving average and notably below the macro trendline beginning in 1998. An interesting sub-story is how the proposed merger between oil services giants HAL and BHI (in November 2014) did not appreciably arrest the decline in oil prices.
I projected that would be the case following the announcement (via Twitter @hertcapital):

A OSX close above 140 in February raises the odds of a rebound to the broken trendline around 165. In my working thesis a rally to the 200-month moving average at 180 is an outlier scenario.
Major oil producing nations, and in particular, those heavily reliant on its revenues are being negatively disrupted with economic implications that are still to be defined. A similar conclusion can be reached for the oil sector and oil stocks. The difficulty in ascertaining the impact is not so much the magnitude of the decline as much as the velocity.
For the investor, the challenge is taking exposure with manageable risk. The trigger will be a positive monthly close for WTI, XOI and OSX based on the technical criteria mentioned above. In my opinion, the optimal approach would be to take broad exposure to the stock sector, thereby bypassing the individual company risk and blending it with some direct exposure to Crude Oil.
“Oil creates the illusion of a completely changed life, life without work, life for free. Oil is a resource that anaesthetizes thought, blurs vision, corrupts.” ― Ryszard Kapuściński, Shah of Shahs
Charts courtesy of Stockcharts.com.
Twitter: @hertcapital
No positions in any of the mentioned securities at the time of publication. Any opinions expressed herein are solely those of the author, and do not in any way represent the views or opinions of any other person or entity.


