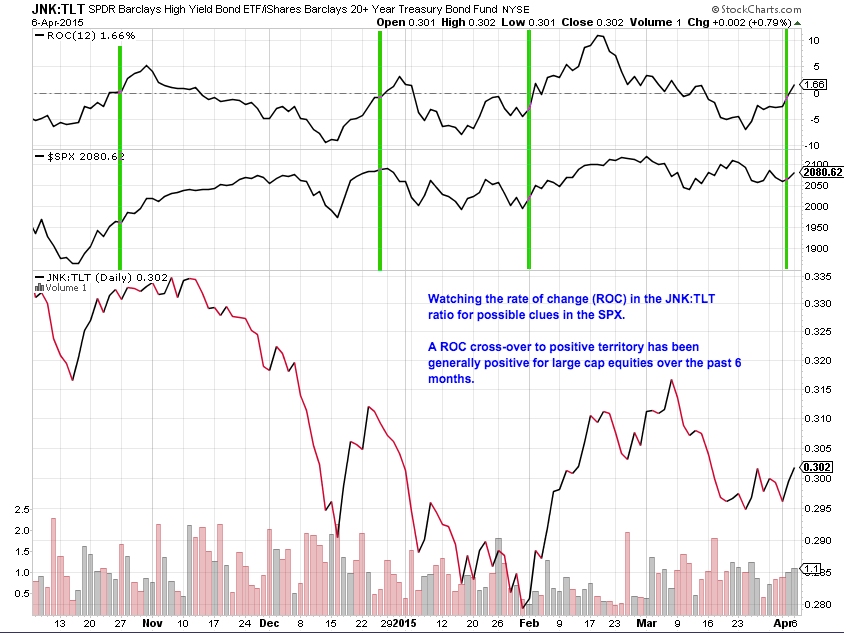
Equities have been choppy lately, making life for traders difficult. One indicator that I like to follow to gauge equities risk on/off is the JNK TLT ratio. And, more specifically, the Rate Of Change (ROC) of the JNK TLT ratio. See the chart below, and notice how this ratio aligns nicely with the movements of the S&P 500.
For reference, JNK is the SPDR Barclays High Yield Bond ETF and TLT is the 20+ Year Treasury Bond ETF. Read here for more on the Rate Of Change (ROC) Indicator.
Generally speaking, a ROC cross over to positive territory has been good for large cap stocks over the past 6 months.
The author does not have a position in the mentioned securities. Any opinions expressed herein are solely those of the author, and do not in any way represent the views or opinions of any other person or entity.


