A couple weeks ago, we warned that energy stocks might be in trouble. We’ve followed and analyzed the entire trend higher for oil and commodities and, now, we are on technical support watch and concerned about commodities breaking down.
Today we revisit the Oil Services ETF to highlight our concern.
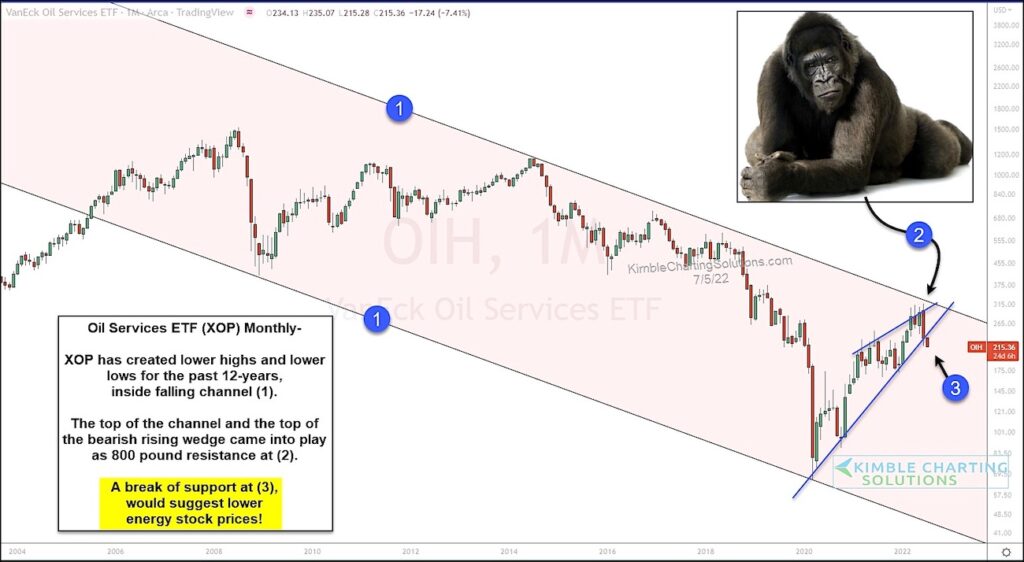
The chart below is a “monthly” chart and, as you can see, this Oil ETF has been in a long-term downtrend marked by each (1). Price has formed lower highs and lower lows for the past 12 years.
The latest rally attempt has taken price to the top of the trend channel at (2) while also forming a bearish rising wedge pattern. This 800 pound resistance has seen a monthly bearish reversal, as well as follow-through selling which has many oil bulls concerned.
Price is now starting to fall below the up-trend support line at (3). If price holds below this support, it would suggest lower prices for energy stocks. Stay tuned!
Oil Services ETF “monthly” Chart
Note that KimbleCharting is offering a 2 week Free trial to See It Market readers. Just send me an email to services@kimblechartingsolutions.com for details to get set up.
Twitter: @KimbleCharting
Any opinions expressed herein are solely those of the author, and do not in any way represent the views or opinions of any other person or entity.


