For over 2 years, all crude oil prices did was go higher… and higher. And consumers have been feeling this pain as the gas pump.
Well, this month crude oil prices turned sharply lower joining the broad based commodities selloff. Could this be the start of a long awaited pullback? If so, oil related stocks and sectors would likely also turn lower.
It’s that day of the week, so let’s turn to Joe Friday for “The facts, Ma’am. Just the facts.”
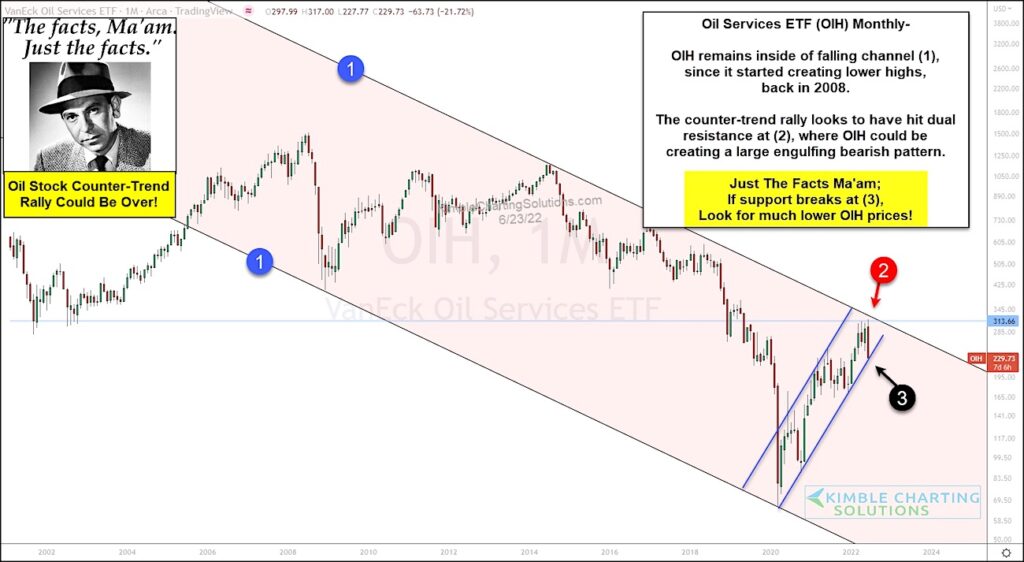
Today’s chart is a long-term monthly chart of the Oil Services Sector ETF (OIH).
As you can see, OIH has been in a falling channel marked by each (1) since it started creating lower highs back in 2008.
The latest 2-year counter-trend rally looks to have hit dual resistance at (2), where OIH could be creating a large bearish engulfing pattern. And this month’s turn lower is now testing important trend line support at (3). If this support breaks, oil stocks could head much lower!
Could the oil stocks counter-trend rally be over? Stay tuned!
$OIH Oil Services Sector ETF “monthly” Chart
Note that KimbleCharting is offering a 2 week Free trial to See It Market readers. Just send me an email to services@kimblechartingsolutions.com for details to get set up.
Twitter: @KimbleCharting
Any opinions expressed herein are solely those of the author, and do not in any way represent the views or opinions of any other person or entity.

: Showing Some Signs of Emerging Strength")
