We have covered the commodities rally and highlighted the everyday concerns with rising inflation and rising interest rates.
Today, we’ll revisit some long-term charts of key commodities and discuss why we should be watching for potential topping formations.
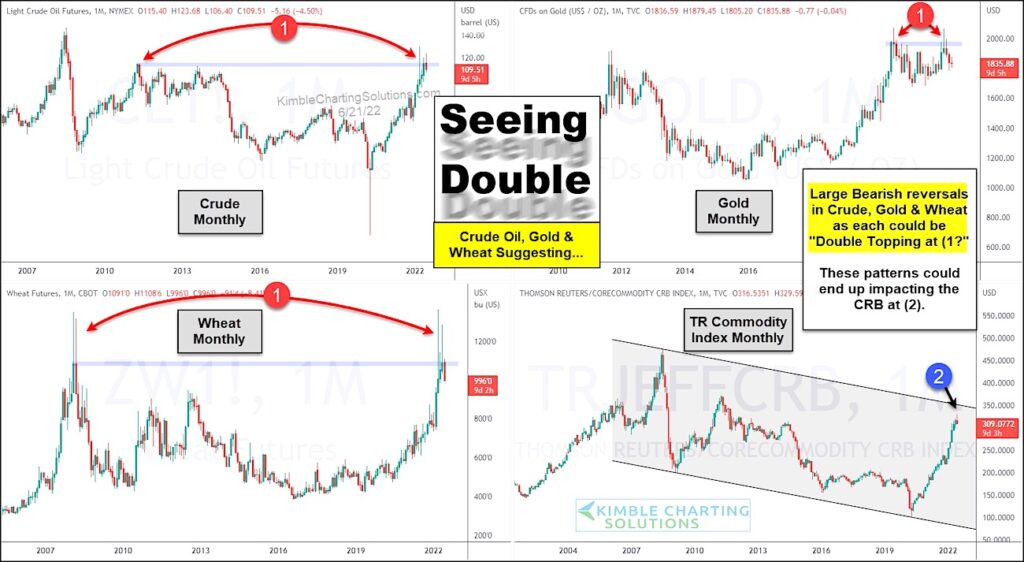
Below is a 4-pack of charts looking at Crude Oil, Gold, Wheat, and the TR Commodity Index.
As you can see, the charts for Crude Oil, Gold, and Wheat appear to be creating double top patterns each at (1). Each of these charts are also creating “monthly” bearish reversals.
Further, if this charts are reversing lower they will impact the other chart of the Commodity Index. As you can see, the index is also creating a bearish reversal at important resistance at (2).
A strong reversal lower would be bearish for the commodities sector. And perhaps some positive news for inflation. Stay tuned!
Commodities Long-Term Charts
Note that KimbleCharting is offering a 2 week Free trial to See It Market readers. Just send me an email to services@kimblechartingsolutions.com for details to get set up.
Twitter: @KimbleCharting
Any opinions expressed herein are solely those of the author, and do not in any way represent the views or opinions of any other person or entity.


