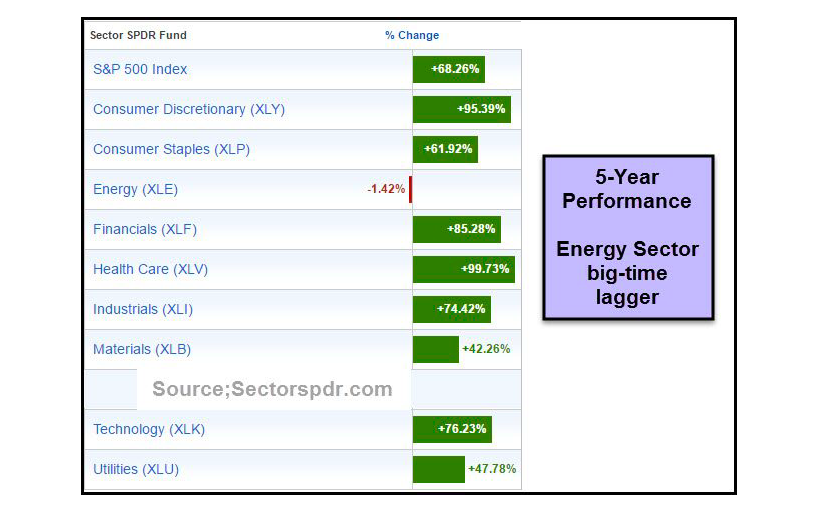
The table below looks at the performance of the major S&P 500 sectors over the past 5 years. One sector stands out… and for the wrong reason.
The Energy Sector ETF (NYSEARCA:XLE) has been a notable laggard (-1.42%). It has lagged the S&P 500 (NYSEARCA:SPY) by nearly 70% over that 5 year period.
So here’s a good question: “Is it time for them to rally?”
S&P 500 Sectors – Performance (past 5 years)
The chart below look at the Energy Sector’s (XLE) performance vs the S&P 500. This ratio shows how deeply the sector has underperformed over the past 17-years. But looking closer at the chart, we can see that it present a nice entry for a counter-move (with a stop below point 2 – support).
Energy Sector (XLE)/S&P 500 Ratio Chart
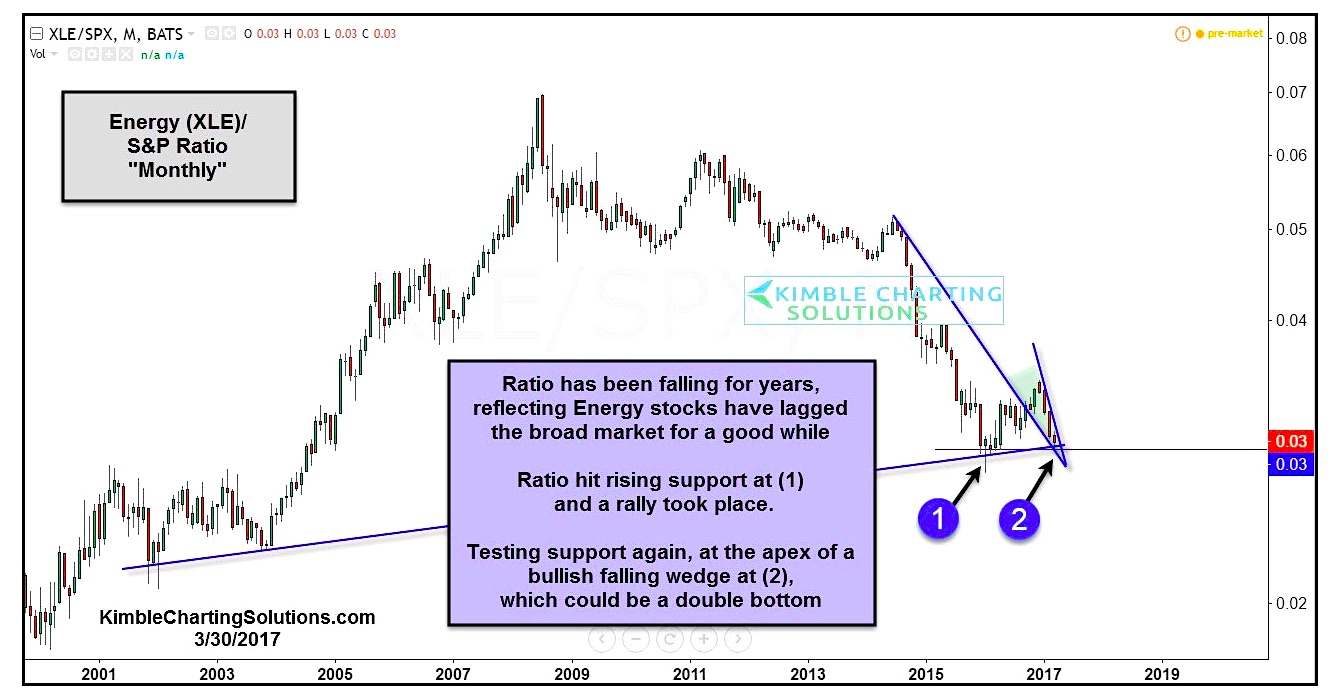
The long-term trend is still down (lower highs and lower lows and below long-term moving averages). So if one is a trend follower, we doubt that this sector interests you.
However, if one likes to buy beaten down out-of-favor sectors with well-defined stop-loss parameters (and is willing to enforce them), then the energy sector looks interesting here.
Thanks for reading!
Twitter: @KimbleCharting
Any opinions expressed herein are solely those of the author, and do not in any way represent the views or opinions of any other person or entity.


