The Dow Jones Industrials and S&P 500 lost 1.3% last week, leaving those stock market indices up just 1.0% through the first four months of 2016. The weakness was directly the result of first-quarter profit declines and a report that GDP growth for the first quarter was an anemic 0.5%, the worst performance in two years.
The markets were also impacted by the Bank of Japan’s surprise failure to provide additional stimulus and the Federal Reserve’s indecision on interest rates for the remainder of 2016.
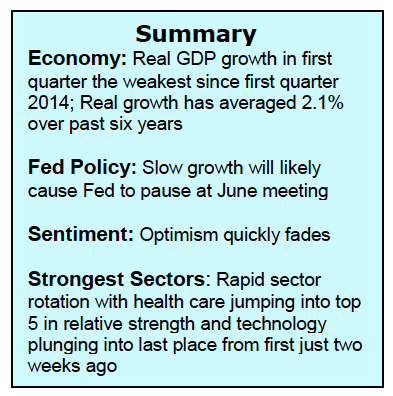
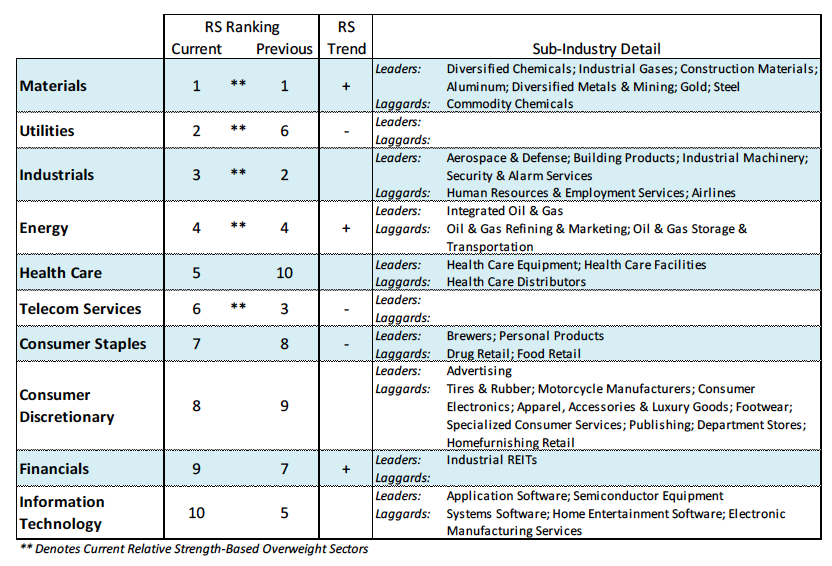
The past weeks have exhibited a rapid sector rotation with energy and material issues surging and technology stocks plunging in relative strength. This sector rotation could be suggesting that there is not enough money available for all areas of the market and that a build-up in liquidly is necessary before the market makes another effort at new highs. The important news this week centers around today’s ISM Manufacturing Index and Friday’s Employment Report which are anticipated to show steady growth.
Short term, stocks are expected to continue in a relatively tight trading range as we move deeper into the second quarter. The risk is seen to 2025 and the reward to 2100 using the S&P 500. The market entered April with the S&P 500 near 2055 and exited the month with virtually no change. The sidewise movement served a dual purpose. It relieved the overbought condition found at the beginning of the period and anchored investor expectations.
Looking further out, the bullish case is gaining strength. While the popular averages have not made much progress, beneath the surface a more bullish argument is emerging. An increasing percent of industry groups are in up-trends as sector rotation attempts to further define leadership. The deteriorating breadth trends seen a year ago are now being replaced with broad market participation. Even on days when the S&P 500 struggles to make any headway, the market is able to produce more advancing issues than decliners. The performance of the broad market appears to be suggesting an optimistic long-term scenario. Bond yields are very low, credit spreads have contracted, and U.S. exports and profits are likely to return later this year with the path of least resistance expected to be to the upside.
Thanks for reading.
Further reading: Weekly Stock Market Outlook: Is The VIX Signaling Trouble?
Twitter: @WillieDelwiche
Any opinions expressed herein are solely those of the author, and do not in any way represent the views or opinions of any other person or entity.


