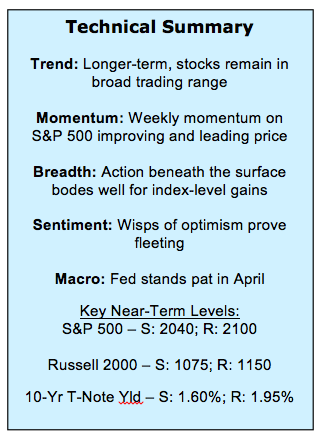
April 29 Stock Market Outlook and Technical Review
Here’s a look at some key stock market indicators, charts, and themes that we are watching:
Does It Seem Like We Have Been Here Before? The more stocks move around, the more the S&P 500 seems to be standing still. A conundrum perhaps, but the chart doesn’t lie. In the past 12 months, the S&P 500 has made a new all-time high and a new 2-year low, with two double-digit declines and double-digit rallies thrown in for good measure.
Bullish Case Gaining Strength – While a lot of noise but not much progress is being seen at the index level, beneath the surface a more bullish argument is emerging. The average stock is getting back in gear, and an increasing percent of industry groups are in up-trends. The deteriorating breadth trends seen a year ago are now being replaced with improving market breadth trends. Even on days when the S&P 500 struggles to make any headway, the broad market is able to power ahead.
Is The VIX Signaling Trouble? Sentiment generally is mixed, but one area that appears to be signaling investor complacency is the recent drop in the Volatility Index (VIX). A closer look shows, however, that low VIX readings can persist for some time and do not reliably point to stock market peaks.
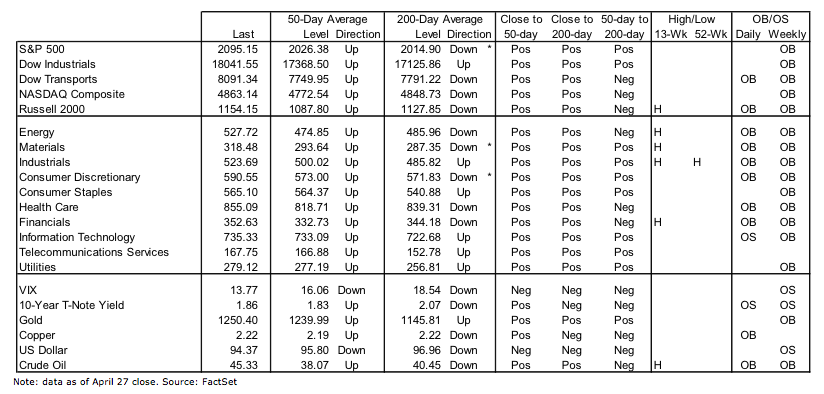
Stock Market Indicators – Indices & Sectors (click to enlarge)
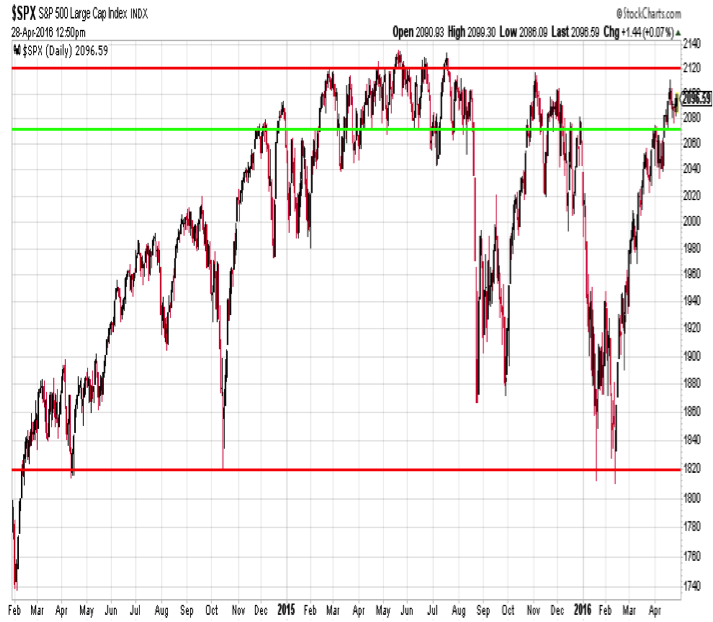
S&P 500 Index
The S&P 500 first closed above 1800 in late 2013. What began as an uptrend has morphed into a broad trading range. The S&P 500 has tested support near 1830 on four different occasions, while over the past year it has traded through the 2100 level more than 50 times. Also over the past year, the S&P 500 has seen declines of 12% and 13%, while also witnessing rallies of 13% and 15%. For all that noise, the S&P 500 trades today almost exactly where it was a year ago.
S&P 500 Index Chart – Bollinger Bands
While day-to-day and week-to-week volatility has been wrenching at times, monthly volatility has contracted. I don’t usually feature Bollinger Bands (which expand and contract around a moving average based on observed volatility), but this chart from Steve Deppe (on Twitter: @SJD10304; Note: R.W. Baird neither endorses the credibility nor affirms any Twitter content as reliable or accurate) caught my attention. The transition from up-trend on the S&P 500 to consolidation over the past two years has resulted in a significant narrowing in the width of the monthly Bollinger Bands. The last time it happened to this degree was in the early 1990s. Following that period of consolidation, the up-trend aggressively re-asserted itself.

Market Breadth Indicators
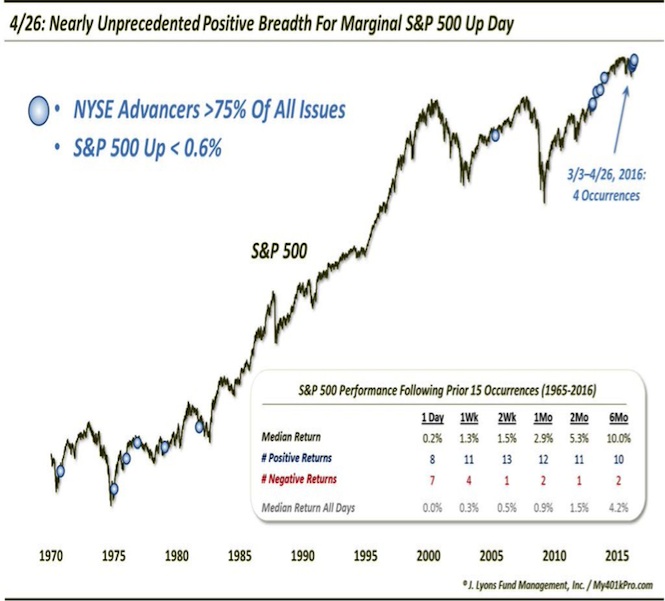
Increasingly supporting the case for an upside breakout has been the performance of the broad market.
Over the past week, we have observed several trading days where the S&P 500 has not really gone anywhere but yet the number of stocks trading higher has been robust. Dana Lyons (on Twitter: @JLyonsFundMgmt; Note: R.W. Baird neither endorses the credibility nor affirms any Twitter content as reliable or accurate) took a close look at this. Not only has this level of positive breadth on marginal up days for the S&P 500 been rare (only 15 observations over the past 45 years), but the results show that the S&P 500 has tended to follow the lead of the broad stock market.
The strength seen among individual issues can also be seen at the industry group level. This stock market breadth indicator is on the cusp of a bullish breakout following a much broader rally than was seen in late 2015. In some ways, an even more bullish breadth signal would come if the S&P 500 pulls back somewhat from current levels with breadth trends remaining robust.
continue reading on the next page…

: Showing Some Signs of Emerging Strength")
