U.S. shale oil has outperformed expectations, but with continued talk of more financial prudence in the recent earnings season, we see a high likelihood for less stellar growth than in years past.
Along with a newfound financial discipline, there are a number of key drivers that point to a slowing of U.S. oil production growth. These include limited capital availability and resource maturity.
Chart 4 below shows that total U.S. production is growing, but at a much slower pace. What’s worth noting is that rig counts have fallen 24% over the past year.
This is significant and is an early sign of what’s to come (Chart 4). Shale productivity gains have also moved into the later innings.
Top locations have already been drilled, and there is distinct potential of seeing peak shale production in 2020 given higher decline rates in less than optimal locations.
Demand
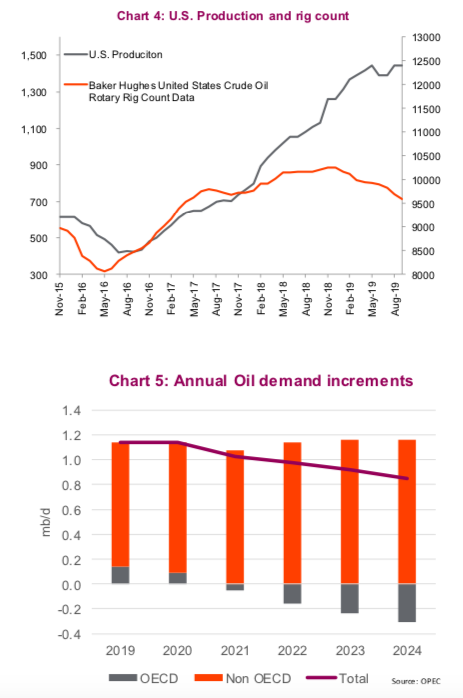
Oil demand growth has fallen, given the recent slowing in global economic growth.
The overhang of falling potential demand far out into the future due to changing demand habits will be a long-term constant for the industry. But its death has been greatly exaggerated. The truth of the matter is that as the global population grows, and emerging economies play catch up with developed nations, the outlook – at least in the short and medium term – is positive (despite what Greta may have you believe).
Energy demand is expected to increase in every five-year period to 2040, according to the recent OPEC World Oil Outlook, though the pace of demand growth will likely slow. And an OPEC outlook is perhaps not the most objective source. In the near term, global consumption is at risk, if what we’ve seen in the manufacturing space fails to stabilize and potentially worsen.
For the most part, analysts and traders are relatively neutral on WTI crude prices. Analysts and traders are neutral on WTI crude futures, a Bloomberg survey showed. Of 16 surveyed, 56% were neutral, 31% were bullish and 13% were bearish. Barring an imminent recession, $60 feels like the sweet spot with minor gyrations around it. Our outlook for crude prices is not incredibly bullish, but $60 crude is profitable for North American energy producers, and it is the massive disconnect between the physical market and equity prices that is most intriguing.
Energy sector
While there is little debate that the energy macro backdrop looks challenging with increasing supply and demand somewhat squishy, for investors the more salient question is whether equity valuations and current stock price levels are appropriate. Is the equity market over or under-reacting, or does it have it right? That is where potential investment opportunities or pitfalls lay.
Looking back to periods when oil was $100 is of little investment use; the likelihood of such a repeat at this stage of the market cycle seems almost impossible (unless a material supply disruption). But even looking at stock price performance since the crash in oil prices in 2015, should interest the value investors of the world. This is more so in Canada, as the Canadian Exploration & Production index has dropped 50% over the past three years.
Pipeline constraints, increased regulation, lack of foreign investment, the list of reasons goes on. As a general rule, share prices don’t get cut in half unless there is lots of bad news. So, has the lack of love or distaste for Canadian energy gone too far?
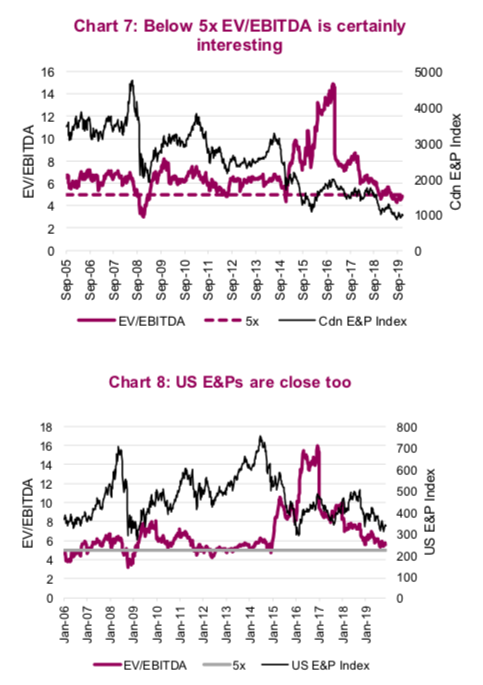
One of my early career mentors, Dunnery Best, had a simple rule of thumb: when E&Ps (exploration & production companies) are trading below 5x cash flow, you should plug your nose and buy them. At least that is how I recollect – it has been a while. Today, the Canadian E&Ps are trading at 4.8x and the U.S. E&Ps are a little higher at 5.6x (Charts 7 & 8). This is cheap, for a host of good reasons, but cheap nonetheless.
What Happens Next?
Investing is all about attempting to calculate probabilities and the magnitude of the impact on share prices. For instance, there are probably two general scenarios that could happen next:
- Recession. If we have one in the next year, that is not going to be good for oil prices nor energy share prices, even if valuations are currently very low.
- Global growth improves. If the slowing growth abates, and this goes down as the third soft patch of this aging long cycle, this sector will fly. Lower quality, weak balance sheets would rise the most, followed by higher quality.
We are currently tilted more towards scenario #2. However, these outcomes could potentially alter if the decline rates from shale continue to accelerate (bullish), OPEC changes its tune (bearish), and if Canada can build a new pipeline (bullish).
There are a lot of moving parts as energy is either a value trap or potentially one of the great opportunities for the year ahead. We continue to wrestle with this question but, as a general rule, the lower the price and valuation, the less risk there should be. Time will tell how this one plays out.
Charts are sourced to Bloomberg or Richardson GMP unless otherwise stated.
Twitter: @ConnectedWealth
Any opinions expressed herein are solely those of the authors, and do not in any way represent the views or opinions of any other person or entity.

: Showing Some Signs of Emerging Strength")

