Saudi oil company Aramco may be getting all the headlines but, for the third consecutive week, oil prices measured by the West Texas Intermediate (WTI) benchmark price managed to advance.
Part of the reason is the general rise in risk assets as hopes for a trade deal rise and signs emerge of improving economic data.
This is the longest run of weekly gains since mid-April, which saw oil prices drop almost 17% from an April peak. This goes to show just how much of an impact of a trade war and demand fears have had on the market.
Besides the trade front, the market is also beginning to focus on the upcoming OPEC meeting in early December.
There have been reports that OPEC+ will look to extend the current cuts until June from March. Rather than rely on a wait- and-see approach, the oil cartel may look to get ahead of the significant amount of new production coming online from non-OPEC countries such as Norway, Brazil and the U.S.
Chart 1 below shows just how much of a burden OPEC has had to shoulder. Total production is down significantly, led by Iran (involuntary) and Saudi Arabia (voluntary).
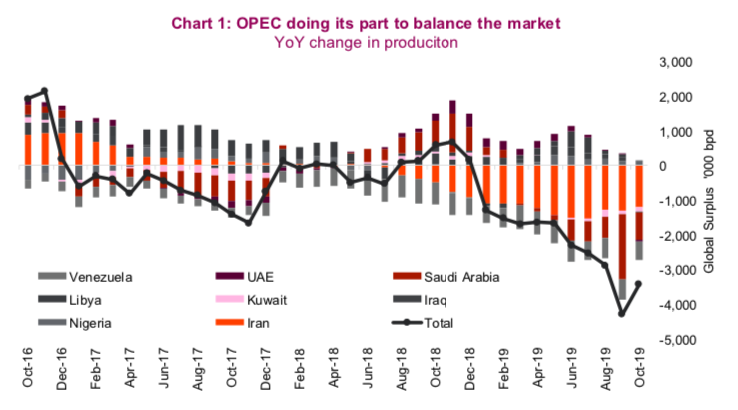
It’s not lost on us that a large reason for this supply management is the upcoming Aramco IPO, set for December 4, and to begin trading domestically on December 11. Prospective pricing shows that they will miss the target $2 trillion valuation initially hoped for.
Though we’ve seen three weeks of gains, oil prices have been fairly rangebound – stuck between $50 and $60 since early June. Currently, we’re nearing the higher end of the range. Besides near-term sentiment, the oil market is largely fundamentally driven. We’re beginning to see some interesting developments on both the supply and demand side of the equation.
Supply
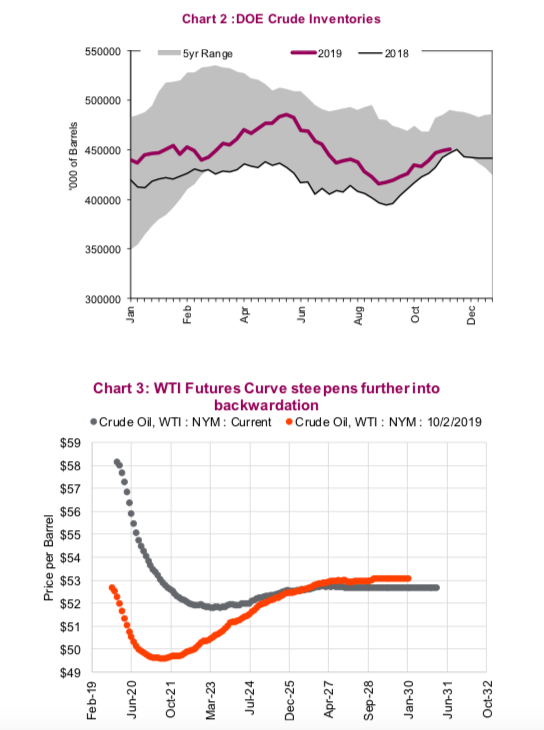
Inventories were in the news last week, with a much larger-than- expected draw coming out of Cushing Oklahoma, falling to the lowest level in about a month. U.S. DOE Inventory levels, as seen in Chart 2, are currently at the low end of the five-year range. Despite inventories running at the low end of the range, there are a number of elements that are pointing to ample supply.
The WTI futures curve (Chart 3) is steepening deeper into backwardation. Front-month contracts have risen significantly over the past few weeks, but the longer-dated contracts have been rather sticky, anchoring around the marginal cost of supply from shale production.
continue reading on the next page…

: Showing Some Signs of Emerging Strength")

