After an incredible comeback from a 65%+ decline from its 2014 highs, crude oil has begun to show signs of weakness since retreating from its yearly high of $47 a barrel. Is it a mere consolidation or a longer term change in sentiment? And further, is the energy sector stalling out? Or ready to rally further?
The tricky part of trading within the energy sector is the vast number of variables that affect prices. Crude Oil prices are subject to inventory builds, OPEC output, stockpiles, rig counts, currency moves and, in particular, the US Dollar. All of these factors can influence the movement in the price of oil and therefore, the price for energy related securities and the Energy Sector ETF (XLE).
Nobody knows for sure where we’re headed in the intermediate term but we can take a look at some signs that help us understand whether something has truly changed or not in the near term.
The weakness in the US Dollar has no doubt played a role in pushing energy stocks higher in recent weeks and I expect we’ll find out just how much of a role if/when we get a true reversal in the Dollar’s decline. Today we saw oil prices retreat as the US Dollar trimmed losses and this is a correlation that is likely to continue in the weeks and months to come.
Yesterday (May 2nd) the New York Fed released its 2016 Oil Price Dynamics Report, where it touched on the impact of oil on overall economic activity for the remainder of 2016: “Excess supply was a significant driver of oil price weakness over the past year, although it was not a dominant determinant like in the second half of 2014. For the first quarter of 2016, the oil price decomposition did suggest a relatively stable supply and this implies little impact from oil prices on overall economic activity in the rest of this year”.
Whether that plays out will depend on the size and nature of the swings in oil prices going forward, as well as on people’s willingness to actually spend the savings from the decline in the price of gasoline. Statistics so far have shown that people have been saving rather than spending the extra cash saved at the pump.
Let’s take a look at some charts across the energy sector for a technical perspective.
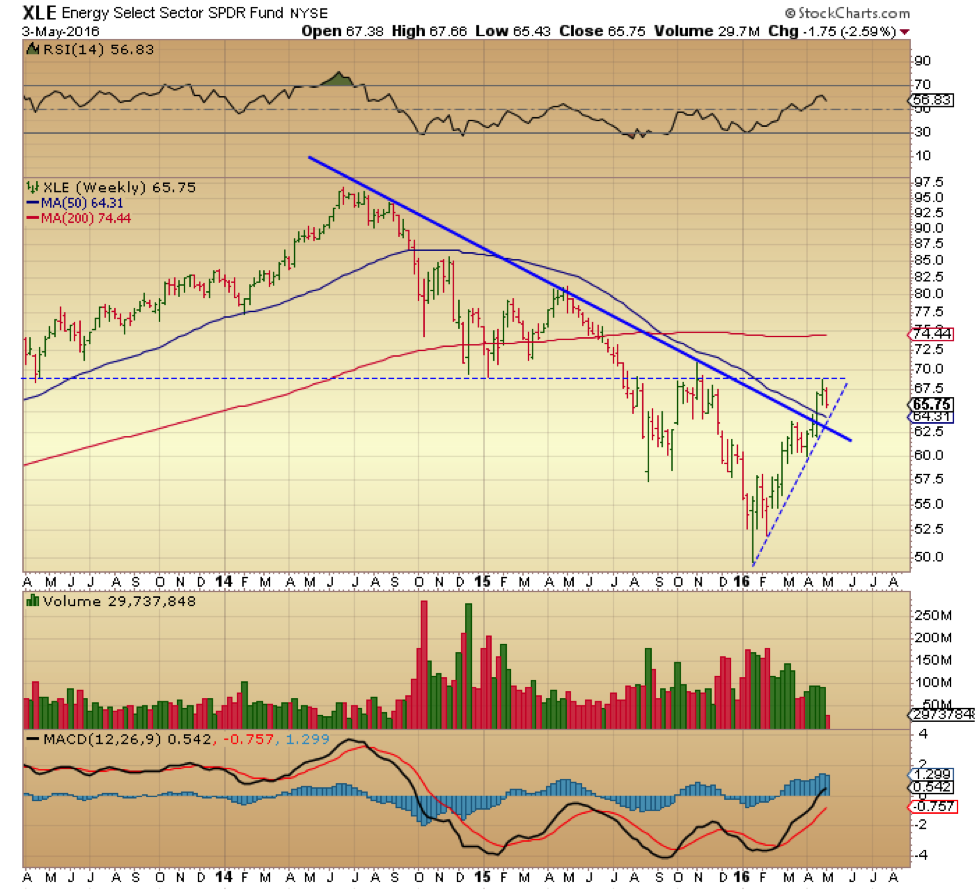
Below we have weekly and monthly charts of the XLE, the SPDR energy ETF. The XLE ramped up 37% since the February lows and in the last few days, has begun to give back some of that gain. The weekly chart should see a resolution in one direction or the other fairly soon as price is reverting back down towards the rising trendline after failing to break above the supply band at $69 last week.
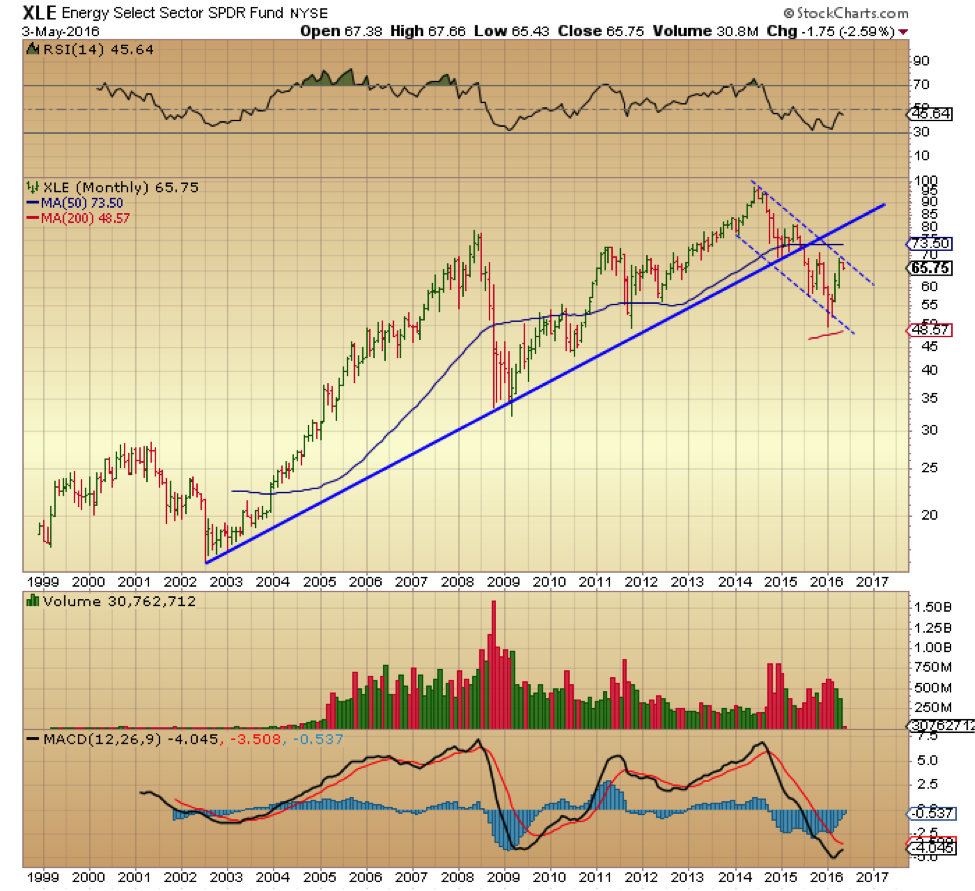
While the weekly has price still holding above the short term rising trend line, the monthly chart shows the XLE still within a two year declining channel despite the recent rally. In other words, the XLE still has not come out of the bear markets it’s been in since the price of oil hit its highs in March 2014. The monthly chart of XLE gives some perspective on just how precipitous the decline of oil prices off the 2014 highs has been. On a longer term timeframe, therefore, the XLE still has much work to do in order to break out of the said declining channel and back above the rising 13 year trend line.
Energy Sector (XLE) Weekly Chart
Energy Sector (XLE) Monthly Chart
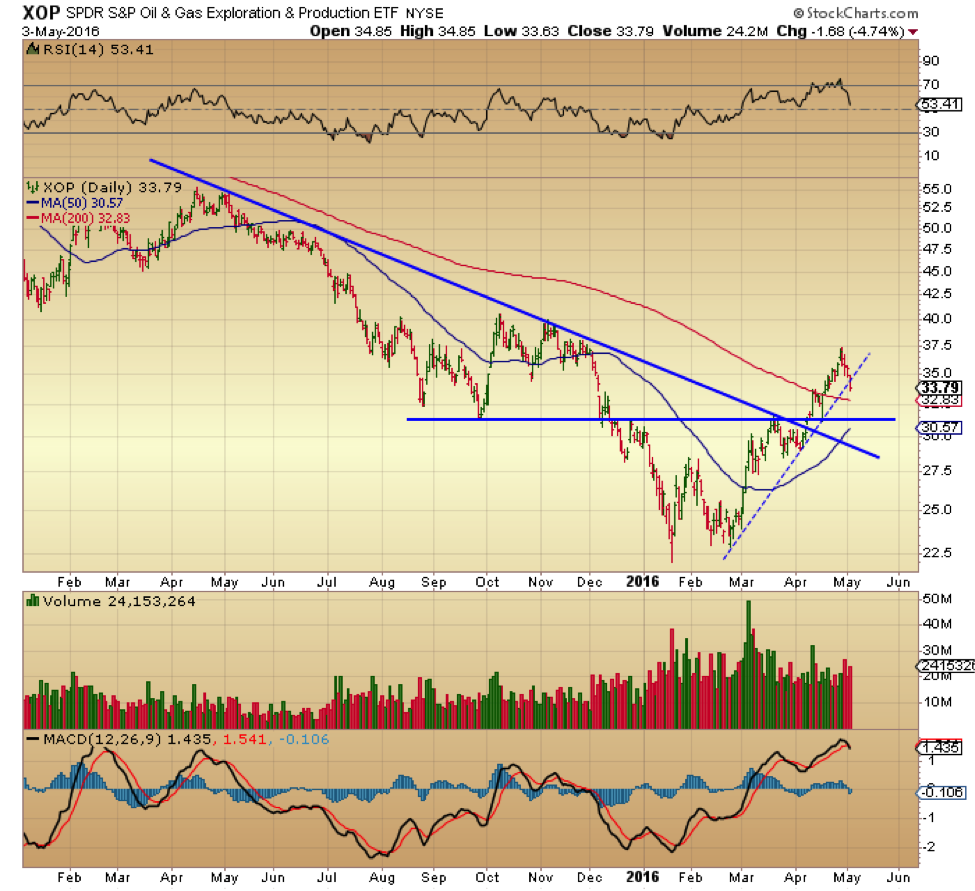
The XOP oil and gas exploration ETF, as shown below, has also been experiencing a sharp decline since April 28th and, today, breached its rising trend line to the downside on the daily timeframe for the first time since the rally began on Feb. 24th. This is undoubtedly a bearish development looking forward. There are multiple levels of support below and we’ll have to see how the XOP handles those if it gets there. Near term levels to keep an eye on are the 200day sma at $32.84 and then horizontal support at $31.30.
Oil & Gas Sector (XOP) Daily Chart
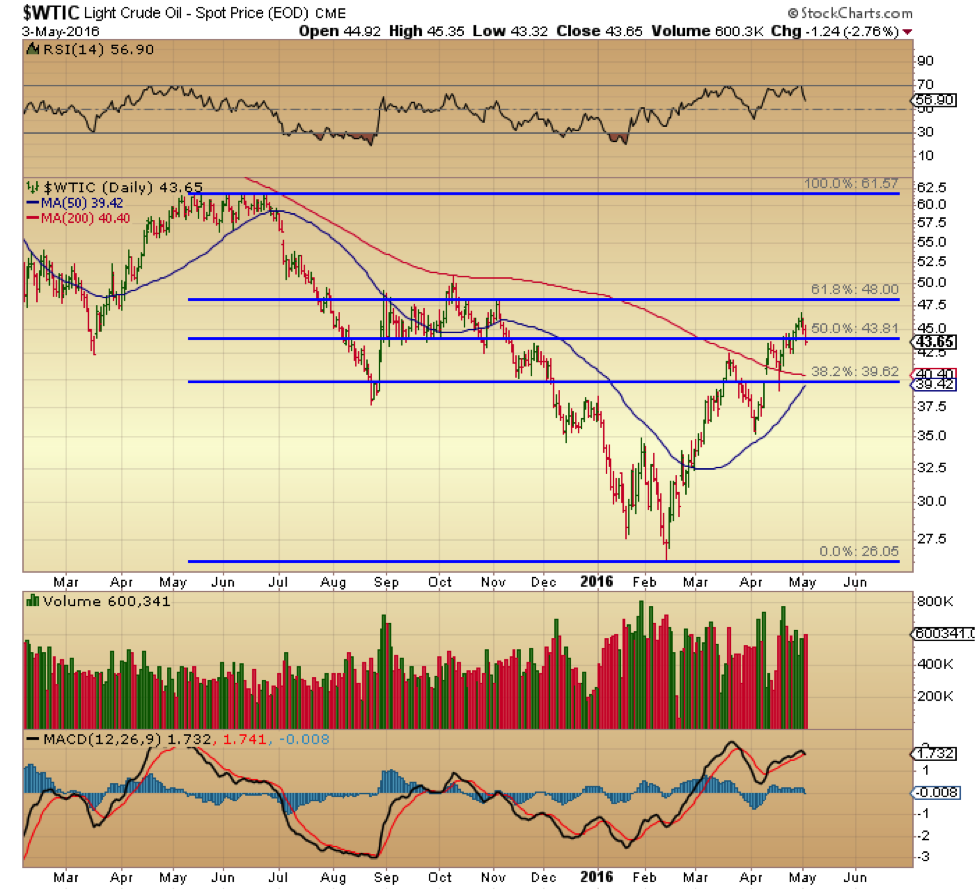
In the daily chart of Crude (WTIC) below, Fibonacci levels come into play and provide an extra level of perspective. Today crude broke back below the 50% retrace of the move from May 2015 to the February 2016 lows. The next level to watch is the 38.2% fib which represents heavier support with the intersection of the 50day and 200day simple moving averages. A break below that $39 level would not bode well for oil bulls. As mentioned before, there are a number of variables that determine movements in the price of oil but in view of the relevance of fibs here, it’s not a bad idea to keep an eye on them going forward.
WTI Crude Oil Prices Chart
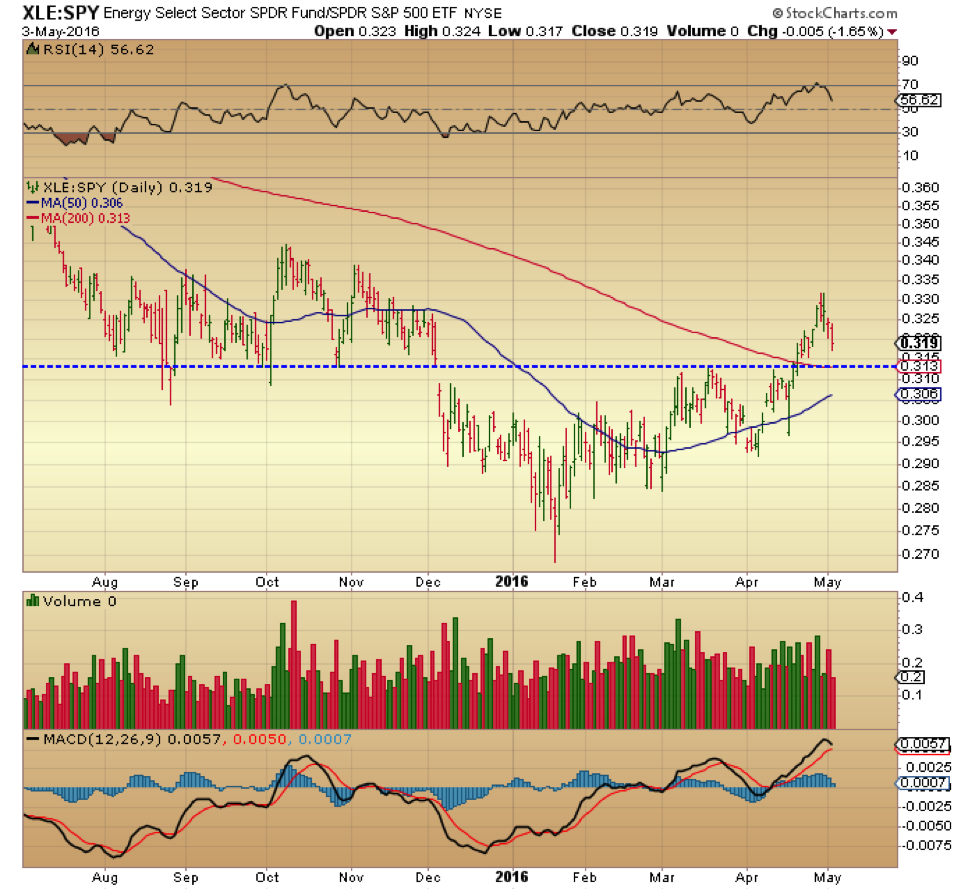
Lastly, let’s take a quick look at the daily chart of XLE relative to SPY. Here too we reversed the uptrend on April 29th and are quickly approaching multiple support just 2% below its current level. Despite SPY’s strong uptrend from the February lows, XLE has outperformed it for the last ten weeks. That may be changing. We’ll know soon enough.
XLE : SPY Relative Strenght Ratio Chart
The question now is whether the energy sector is in a new uptrend following a two year decline or whether the last ten weeks have simply been a counter trend bounce with the longer term downtrend. The recent pullback is not sufficient to provide a reliable response.
Answers to such scenarios generally materialize long after bottoms or tops have been put in and are therefore recognized as such in retrospect. With that in mind, some consolidation here would be a healthy and welcome outcome for bulls looking for continuation of recent strength. We’re approaching some technical levels on various energy related charts that will likely put the debates to rest in the near future. Nothing tells it like price.
As is often the case, there is no lack of differing opinions on where the price of oil is headed, but the truth is that the numerous variables involved, as mentioned above, are ultimately expressed faithfully in price. The pullback from the recent uptrend is, for now, nothing more than a pullback and should be treated as such until price tells us otherwise. Oil prices have thrown egg on quite a few famous faces in the last few months, no need to get in front of those trajectories.
Thanks for reading.
More from Marco: Russell 2000 Update: Where Bulls And Bears Collide
Twitter: @DDCapitalFund
The author does not have a position in mentioned securities at the time of publication. Any opinions expressed herein are solely those of the author, and do not in any way represent the views or opinions of any other person or entity.


