The Russell 2000 has been lagging the S&P 500 pretty consistently since 2014 but small caps now seem to have woken up and have caught up to the broader stock market indexes in the last 8 weeks. The strength of the rally off the Feb. 11th lows was impressive but recent price action has brought the small caps ETF (iShares Russell 2000 – $IWM) on the verge of a breakout.
The question is: Can it muster up the strength to keep going and take its rally to new heights?
The recent performance of the Russell 2000 (IWM) is a good sign for market bulls which like to see rallies supported by risk on sectors like the small caps. The IWM closed out a strong week on Friday with a 3% move that saw the index move out of the red (year-to-date) on an intraday basis – that was the first time in 2016. And at the time of this publication (Monday early afternoon), the Russell 2000 is moving further into the green year-to-date.
The question now is, can IWM break out higher from here? Let’s look at some charts:
Russell 2000 ETF (IWM) – Daily Chart
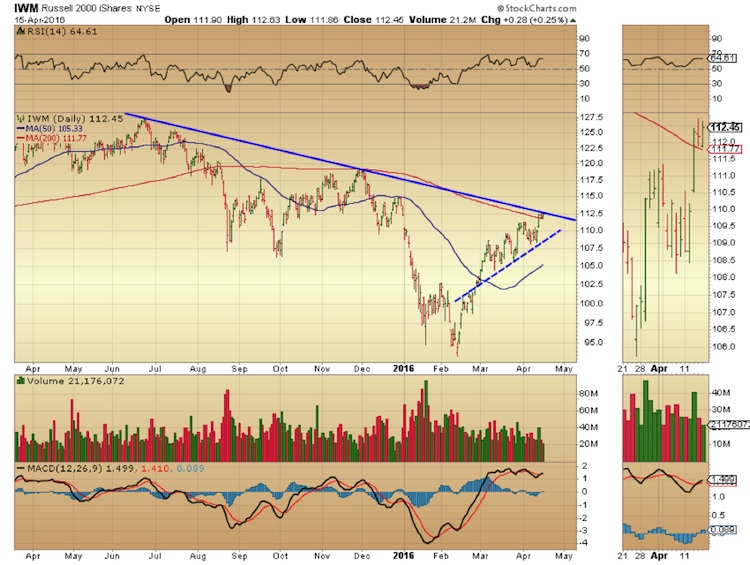
As you can see from the daily chart above the IWM held most of the gain off of Wednesday’s gap and go day where it also reclaimed the 200 day moving average. This is a god sign. It closed the week right below a down sloping trendline from the June 23rd highs. The question now is whether the Russell 200 ETF (IWM) consolidates below that trendline or has the strength to break out above and keep its rally intact. The levels to watch above are $112.55 and $115.30 on IWM.
How it handles itself here is important… for the index and for the broader stock market. The longer it struggles below trendline resistance the higher the chances of it breaking down. A close above $112.55 would be constructive for more upside. Support levels to keep an eye on here are the 200 dma at $111.77, then the $110.50 level which is the low from 4/13 and short term rising trendline support which currently sits at the $109 level.
Let’s take a look at the weekly chart.
Russell 2000 ETF (IWM) – Weekly Chart
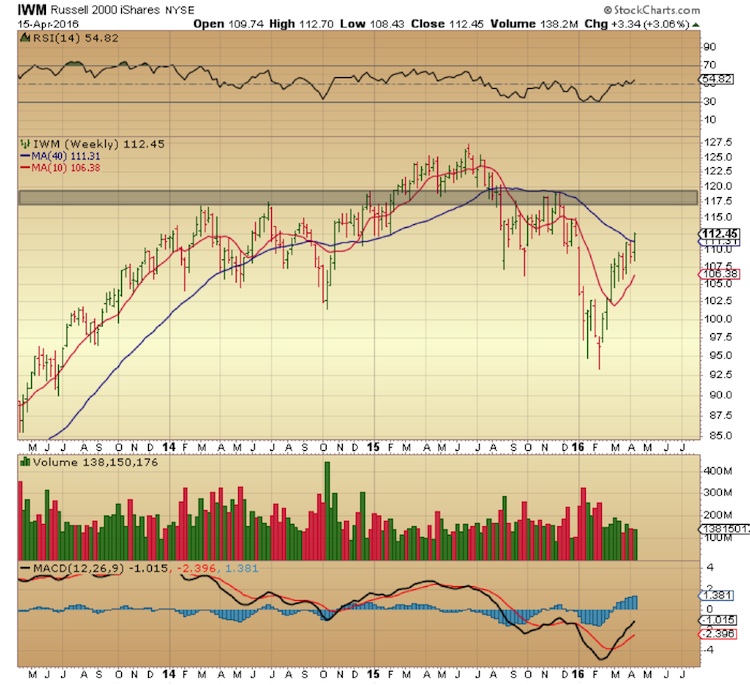
The weekly time frame is also bullish with a series of higher highs and higher lows following the reversal off the lows on the week of Feb. 8th. IWM closed this past week above the 40week moving average for the first time since July 2015.
The Russell 2000 ETF (IWM) now faces a band of resistance at the $117-120 level. It will take quite a bit of determination by bulls to push it up another 6% to those levels from it current level of $112.45. Support below sits at $111.30, $107.40 then $106.40 which coincides roughly with the 10 week moving average. RSI and MACD are rising and support more upside. We’ll see if and how it materializes.
continue reading on the next page…


