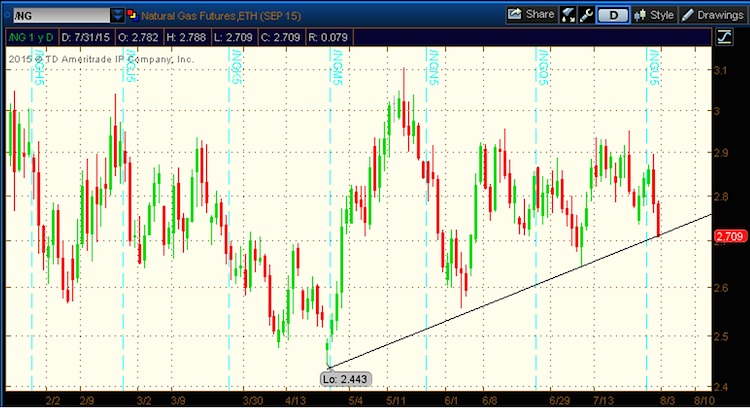
Natural Gas prices appear to be at a critical point point in time (see NG futures chart below). The YTD chart of Natural Gas prices indicates that a key trend line off of a multi-year low put in place on April 27 is in jeopardy of being broken. And that could spell trouble for NG.
Natural Gas prices found support in June and July on this line. Compounding the potential bearish setup, August has historically been an exceptionally weak month – averaging a decline of about 3% from the end of July through very early September. It would make sense for NG to break this trendline very soon then find some support in the $2.40 – $2.50 area before stabilizing and setting up for the possibility of a September/October rally.
The below seasonality chart for Natural Gas prices highlights the bearish month we are about to ensue. EquityClock.com aggregated 20 years of Natural Gas trading from 1990-2009.

Now, let’s look at Crude Oil and see what it’s charts are telling us.
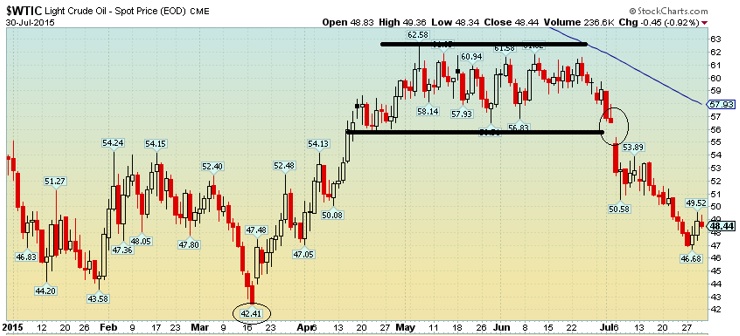
Crude Oil prices rallied sharply off the $42 multi-year low mark in March to above $62 in May. Crude went on to trade in a $6 range between $56 and $62 for about 2 months before July’s rather severe breakdown in price. The bearish breakdown on the chart is noted by the ‘gap down’ on July 6th when it lost about 8% in one trading day – the biggest decline since February 4, 2015. The 8% decline was more than a 3 standard deviation move, using data going back to 2006.
Crude oil ended Friday just below $47. The next support level appears to be the March lows around $42-43. The Gulf Coast 3-2-1 Crack Spread remains robust with Gasoline futures trading well above the winter lows. The crack spread currently sits near $18 versus about $12 a year ago. Should the $42 level break, the 2008 low will be talked about once again, near $33 a barrel.
Crude Oil Spot Prices Chart
Thanks for reading.
Twitter: @MikeZaccardi
No position in any of the mentioned securities at the time of publication. Any opinions expressed herein are solely those of the author, and do not in any way represent the views or opinions of any other person or entity.


 Flirting With Critical Support… Again")


