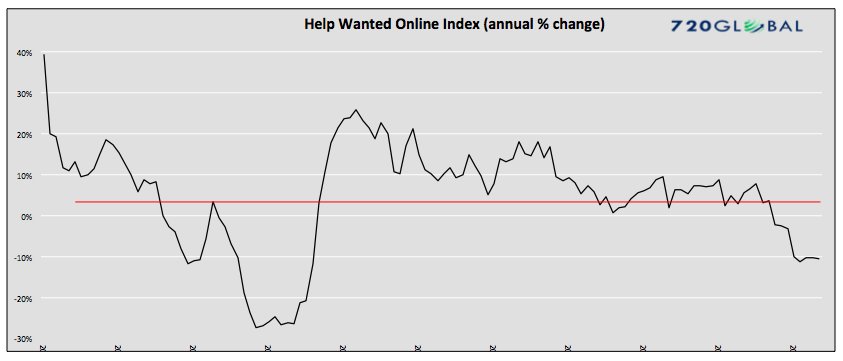
The Conference Board – Help-Wanted Online Index
Since February, the year over year change of this index has dropped below zero. For the last 5 months it has been 10% lower than at the same time last year.
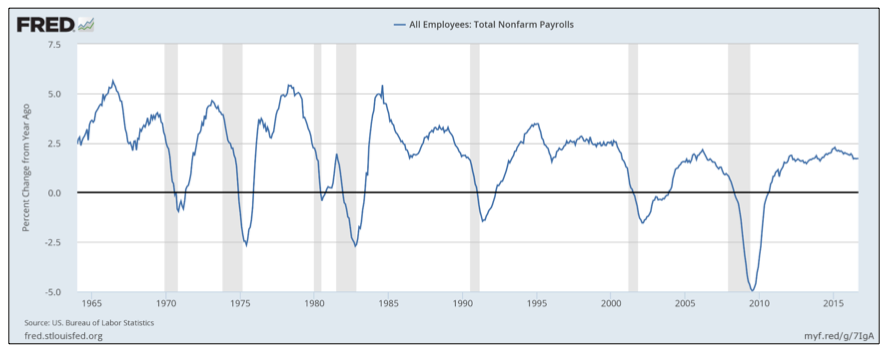
Total Payrolls (annual % change)
The rate of change in payrolls tends to decline 1-3 years prior to recession. The current trend is starting to drift lower from the post-GFC peak. An acceleration of the trend would heighten recession concerns.
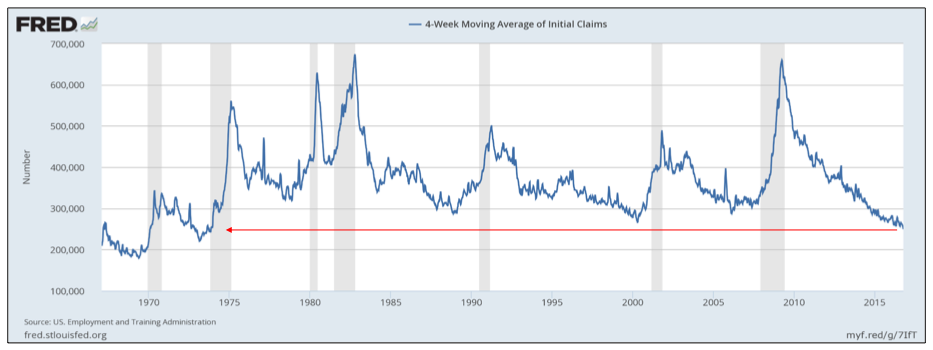
Jobless Claims
Despite all of the other data exhibiting potentially unfavorable trend changes in the labor market, jobless claims continue to decline toward levels last seen in the 1970’s. Jobless claims have been a reliable leading indicator of employment trends in the past. The current trend shown below would not seem to signify employment issues.
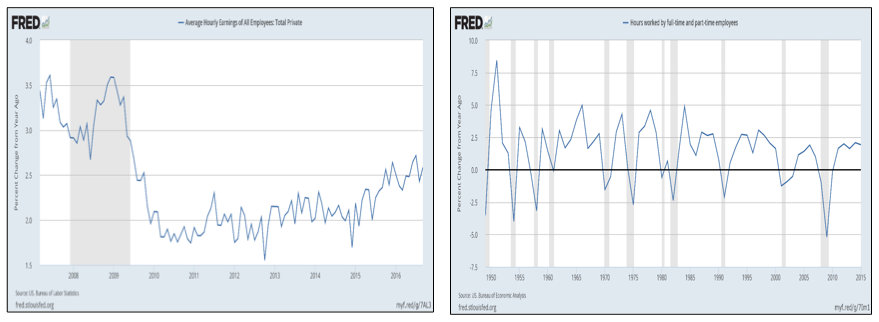
Wages and Hours Worked
Average hourly earnings continue to increase and, like jobless claims, represents healthy demand for labor. Hours worked have stabilized, after rising since 2009, but has not yet begun to decline as is typical preceding recessions.
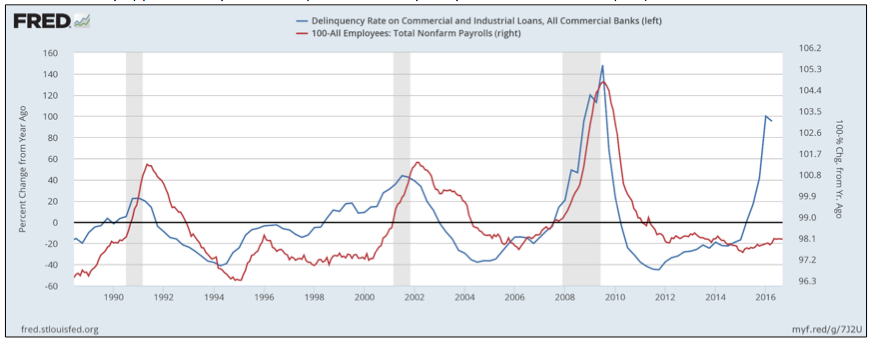
C&I Delinquency Rates and Employment
The annual change in the delinquency rate on commercial and industrial corporate loans (C&I) is inversely correlated with annual changes in employment (and employment trends). Over the last year delinquency rates have spiked higher. Employment, shown inverted on the right axis, has yet to follow suit. (employment = 100 less the % change in year over year employment – therefore total payrolls would fall by approximately 3% if it responds to delinquency rates as it has in the past).
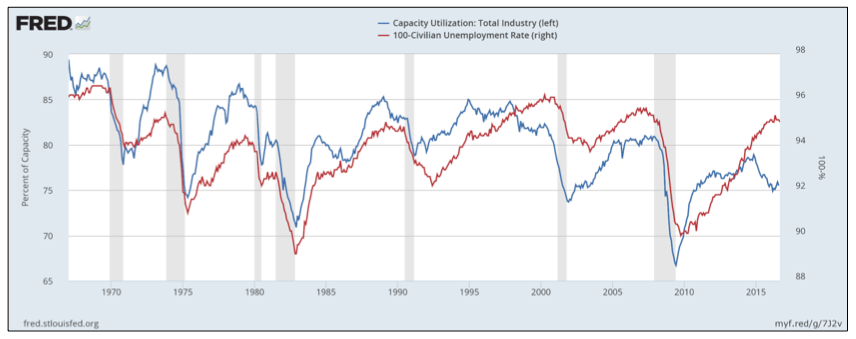
Capacity Utilization and Unemployment
Capacity utilization, or the percentage of resources used to produce goods, and employment are highly correlated. Recently, however, capacity utilization has declined yet unemployment (shown inverted on the y-axis as 100% minus the unemployment rate), has not followed.
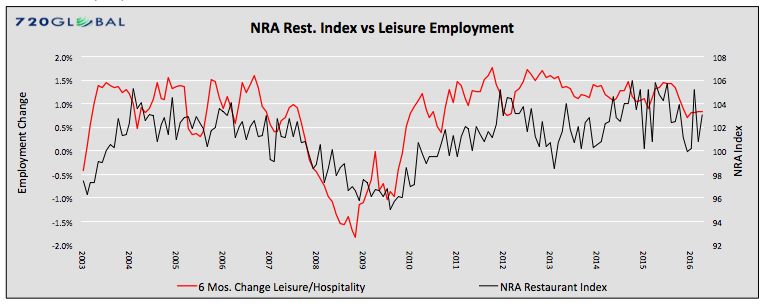
NRA Restaurant Performance vs. Leisure Employment
The National Restaurant Association Performance Index measuring restaurant sales has declined to levels seen only in the prior two recessions. If employment in the leisure and hospitality industry remains correlated to the survey, approximately 225,000 jobs will be lost. As a point of reference, the entire economy has recently only added approximately 150,000 jobs per month. Employment in leisure and hospitality represent 11% of total employment.
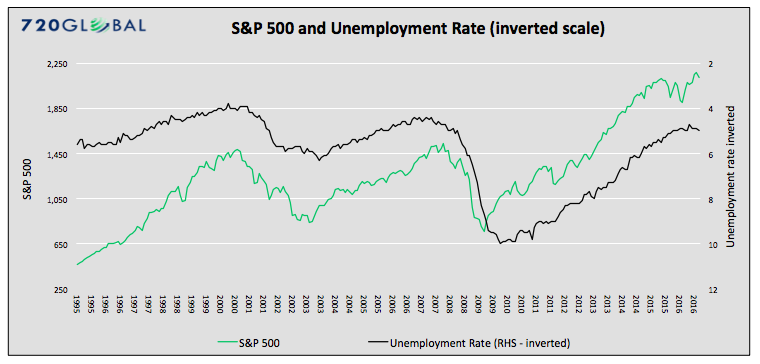
S&P 500 and Unemployment
The trend of the unemployment rate and the S&P 500 are highly correlated. The right y-axis scale for the unemployment rate is inverted to better highlight this relationship.
Thanks for reading.
Twitter: @MichaelLebowitz
Any opinions expressed herein are solely those of the author, and do not in any way represent the views or opinions of any other person or entity.


