On November 4, 2016 the Bureau of Labor Statistics (BLS) released the employment data for October 2016. Economists rely heavily on employment trends & data to help gauge the health of the economy. Investors believe the data provides valuable insight into the likelihood that the Federal Reserve adjusts monetary policy in the near future.
Due to its importance, we put together a series of charts to serve as a gauge of current employment conditions.
Notice that many, but not all, of the post 2008/09 employment trends have stopped improving. While they are not necessarily reversing, consolidations in these trends have led to reversals in the economy (and data) in the past. And in many instances, they have lead to recessions.
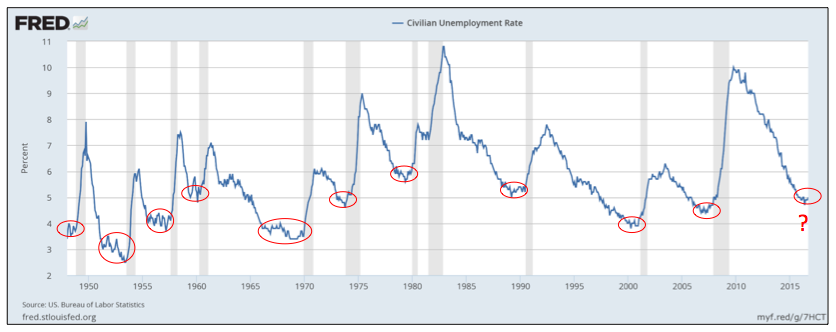
Unemployment Rate
The unemployment rate generally trends higher or lower with short consolidation periods between trend changes. We’ve marked these consolidation periods in red below. Reversals of downward trends in the unemployment rate, followed soon thereafter by measurable increases in unemployment, have always occurred prior to recessions. Recessionary periods are marked by gray bars below.
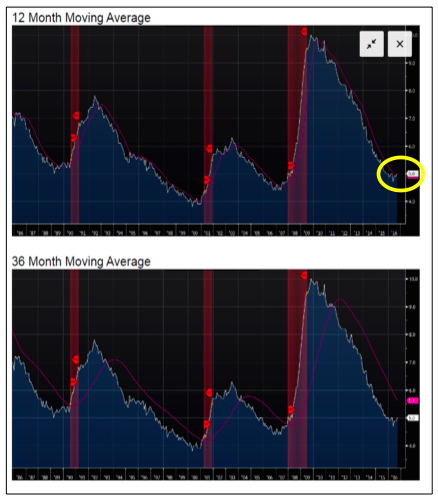
Unemployment Rate Monthly Moving Averages
According to Jeffrey Gundlach of DoubleLine, one should be on “recession alert” when the unemployment rate crosses above its 12-month moving average. That occurred in September 2016.
Further, he believes the unemployment rate crossing of the 36-month moving average to be a more durable recession indicator. Although this has yet to occur, a continued uptick in the unemployment rate would cause it to cross early next year.
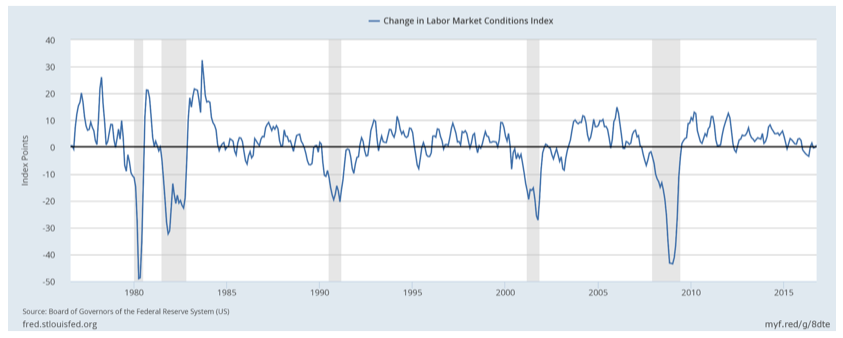
The Labor Market Conditions Index (LMCI)
This Federal Reserve index, which was created by Janet Yellen, is an aggregation of 19 labor indicators. The series has been declining since 2014. Recently it has fallen below zero, which portends weakness in labor markets.
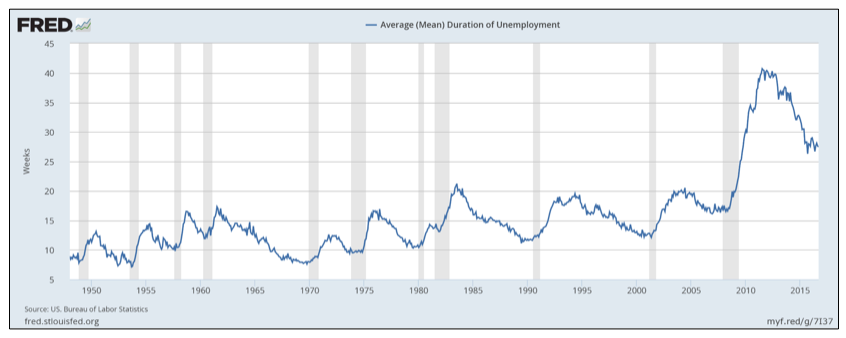
Average Duration of Unemployment
The average amount of time people are unemployed declines during periods of economic growth. Cessation and reversal of this trend has been a reliable predictor of past recessions.
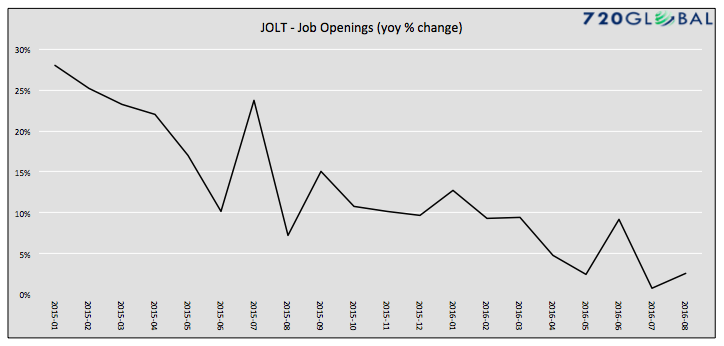
JOLTS Report
The JOLTS job openings report from the BLS has been a favorite Federal Reserve leading indicator for the health of the employment market. Declines in job openings tend to portend increases in unemployment. The year over year change has been trending lower and is approaching zero.
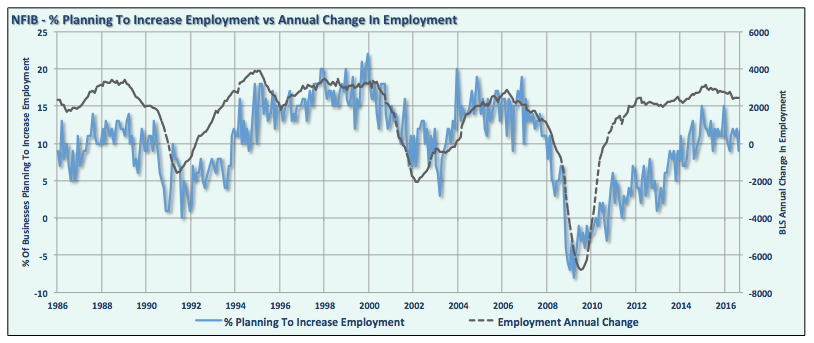
NFIB Small Business Employment Survey
This diffusion index shows that the upward trend in the percentage of small businesses expecting to increase hiring has stalled and may have begun to reverse. The survey is highly correlated to changes in employment. Graph Courtesy Real Investment Advice – Lance Roberts
continue reading on the next page…


