 By Alex Bernal There are some very interesting developments in the elliott wave structure of Natural Gas that could shed some light to where it might be headed in the coming weeks. The first chart I wanted to spotlight is a Natural Gas Elliott Wave snapshot. As you can see there is a completed 5 wave impulse structure in continuous futures price. This would imply that at least for now the trend might be nearing an end to this medium term rally.
Natural Gas Chart – Elliott Wave patterning
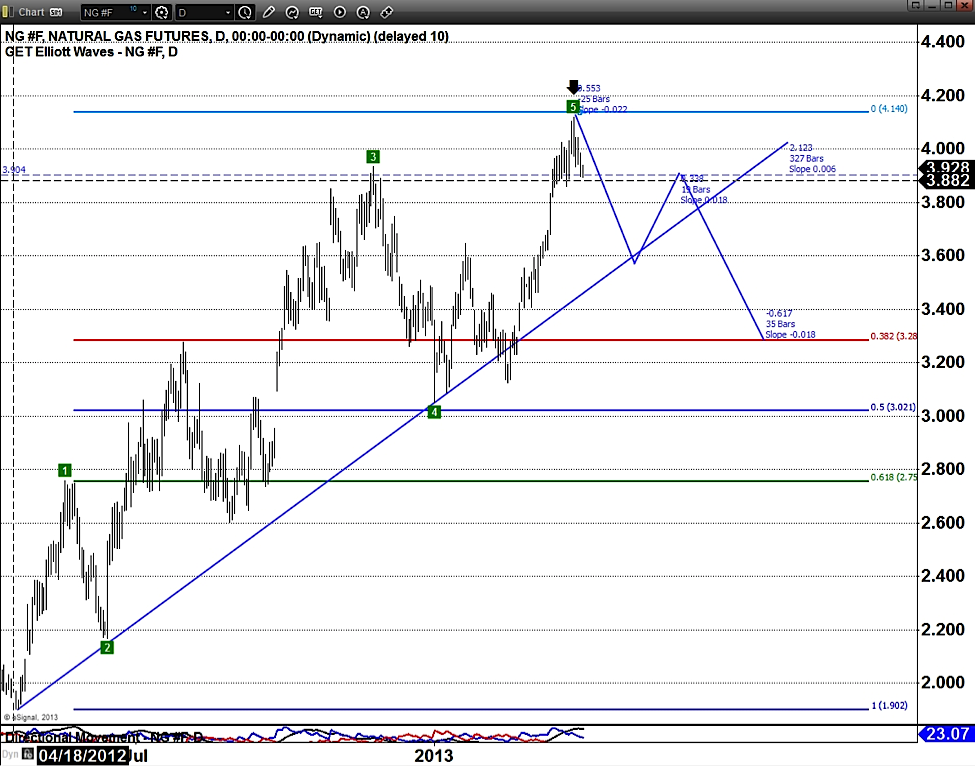
I am expecting some type of A-B-C three wave retracement back towards the uptrend line and possibly terminating somewhere below. Here is a general guideline to follow when forecasting where a wave C will end:
- Wave C typically has a length of 38.2% or 61.8% of the distance from beginning of the wave to the top of wave 5.
A Closer Look Inside the Harmonic Structure of Natural Gas
Below is a chart highlighting the current bearish butterfly pattern setup for Natural Gas:
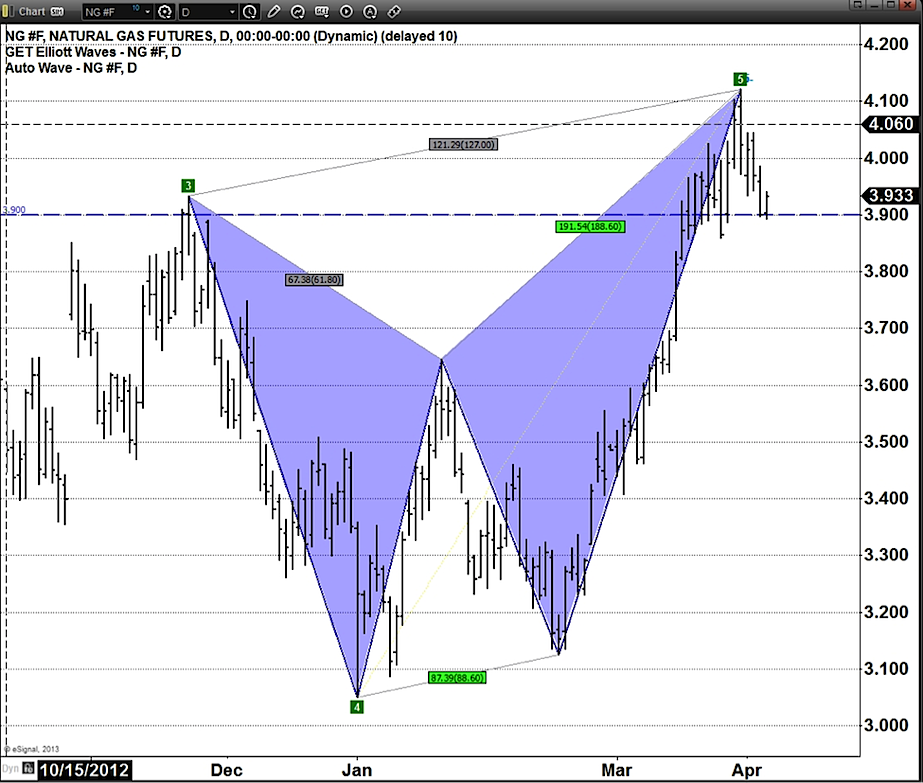
In this Natural Gas chart, I have zoomed in on a portion of the first chart to only show waves 3 to 5. It is very clear that we have a harmonic pattern in place; this is also known as a bearish butterfly. Herein, we see a fractal zig zag pattern that has very specific swing relationships, respecting harmonic ratios. Independent from the completed 5 wave Elliott Wave structure in chart 1, this may suggest that we see a sharp decline in the price of Natural Gas ($NG) over the next few weeks. I have highlighted a very critical level of 3.90 because if Natural Gas falls below this level, it would confirm a failure to susain the breakout above the wave 3 high.
Charts sourced from eSignal
Twitter: @InterestRateArb and @seeitmarket
Author has a short position in 4.00 – 4.20 call spreads at the time of publication.
Any opinions expressed herein are solely those of the author, and do not in any way represent the views or opinions of any other person or entity.


