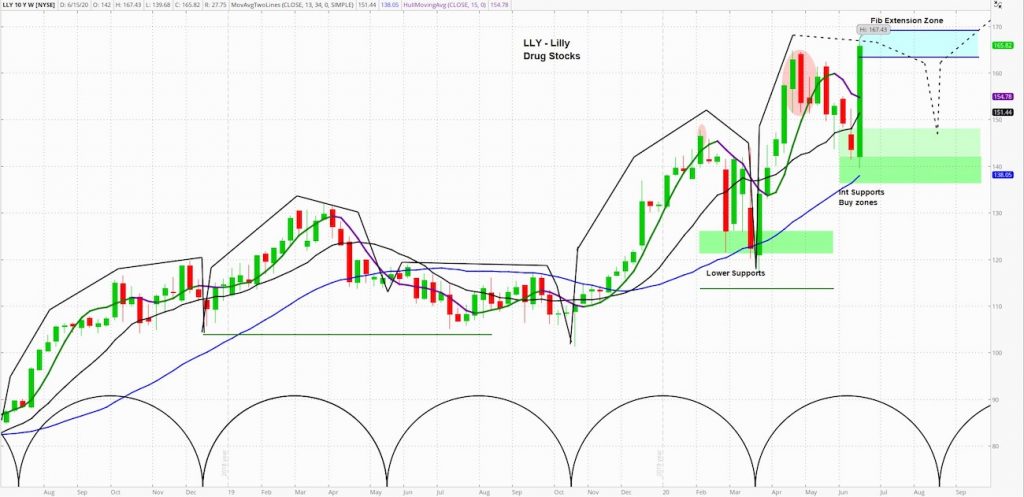
Eli Lilly Stock Chart (LLY) with “Weekly” Cycle Analysis
On Tuesday, Eli Lilly (LLY) announced that its breast cancer drug, Verzenio, met its primary endpoint as part of a Phase 3 drug trial in reducing the risk of breast cancer recurrence.
This news sent Eli Lilly up more than 18% midway through Tuesday’s trading session. Let’s review our weekly cycle analysis.
At askSlim we use technical analysis to evaluate price charts of stocks, futures, and ETF’s.
We use a combination of cycle, trend and momentum chart studies, on multiple timeframes, to present a “sum of the evidence” directional outlook in time and price.
askSlim Technical Briefing:
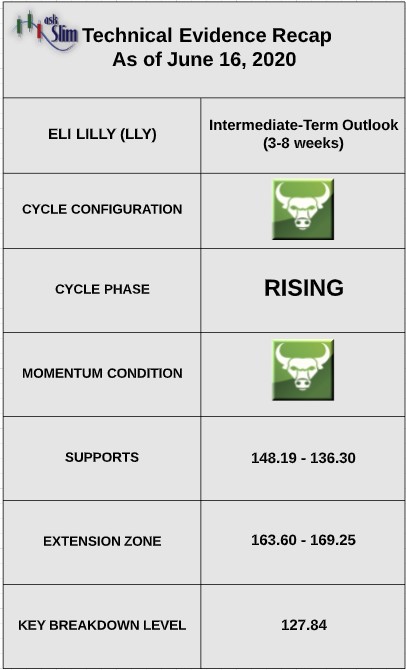
LLY is in a rising phase on the weekly. Weekly momentum is currently negative, but it is likely to turn back up. The next projected intermediate-term low is due in August.
On the upside, there is a Fibonacci extension zone from 163.60 – 169.25. On the downside, there are rising intermediate-term supports from 148.19 – 136.30. For the bears to regain control of the intermediate-term, we would need to see a weekly close below 127.84.
askSlim Sum of the Evidence:
LLY is in the late stages of a rising phase on the weekly. We see limited near-term upside. There is a likelihood that the stock tests the rising intermediate-term supports beginning at 148 by August.
Interested in askSlim?
Get professional grade technical analysis, trader education and trade planning tools at askSlim.com. Write to matt@askslim.com and mention See It Market in your email for special askSlim membership trial offers!
Twitter: @askslim
Any opinions expressed herein are solely those of the author, and do not in any way represent the views or opinions of any other person or entity.

: Worrisome to Broader Market?")
