Dow Jones Industrial Average Chart
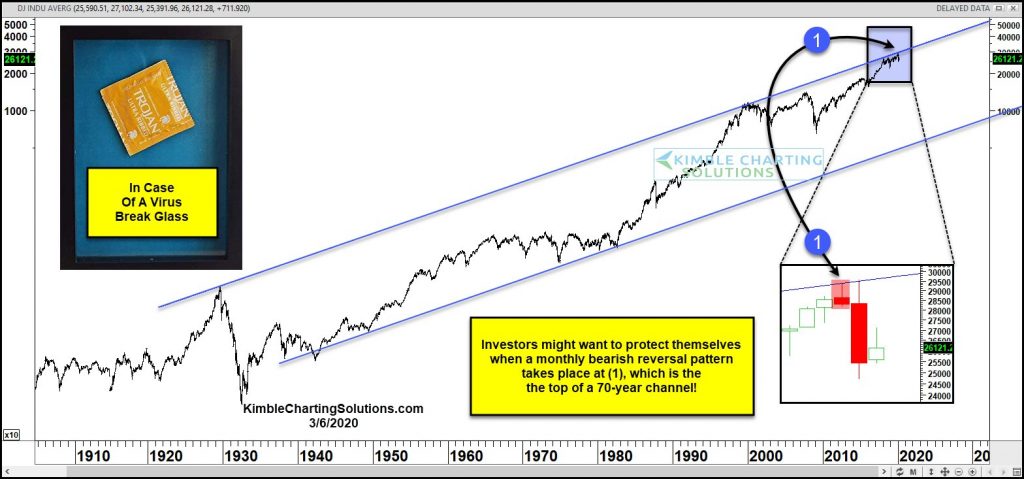
Bearish reversal patterns are always a sign of caution.
But when they happen on broader time frames, like “weekly” and “monthly” candles, they can be of a more serious nature.
In this case, the Dow Jones Industrial Average put in a bearish “monthly” reversal pattern at (1). Note that this coincided with a test of the top of a 70 year rising channel!
This lead to more selling in February (another reversal) and March… and a stock market correction, or perhaps even a bear market. I highlighted this potential “double whammy” for stocks in February.
I post bearish and bullish reversal patterns to help investors identify possible changes in trend (whether it be for trading or investing purposes). Knowing when to beginning taking profits (or making profits) is an important part of investing. Stay tuned!
Note that KimbleCharting is offering a 2 week Free trial to See It Market readers. Just send me an email to services@kimblechartingsolutions.com for details to get set up.
Twitter: @KimbleCharting
Any opinions expressed herein are solely those of the author, and do not in any way represent the views or opinions of any other person or entity.

 Testing Important Price Support")
: Cup (and Maybe Handle) Watch")

