Over the weekend I wrote that “Looking at the SPY chart, we could be setting up for a mean reversion trade (bear market bounce that takes SPY back to 380.)”
I went on to write, “Granny Retail XRT, also in a downtrend, has some good bottoming action, is outperforming the SPY and the momentum on the Real Motion indicator is holding up.”
Then, I commented on another member of the Economic Modern Family, “However, IBB also is outperforming the SPY and showing some balance in momentum.”
Hence, when we awoke this morning to a gap higher in the equities market, the S&P 500 and these other two key sectors did not disappoint.
Yet, there is another key member of the Economic Modern Family that rallied right into resistance.
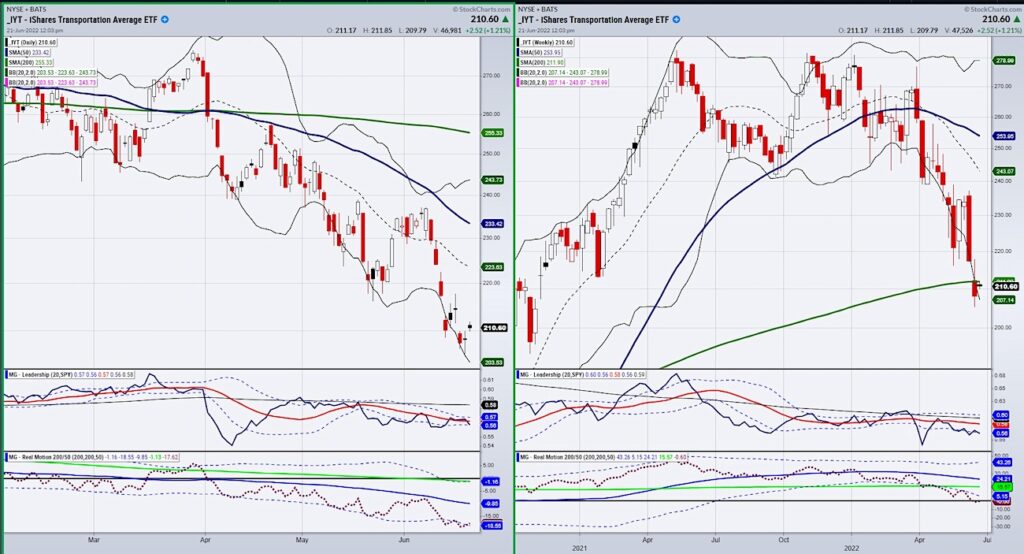
Transportation IYT opened higher, ran to its 200-week moving average, and retreated, albeit whilst remaining green on the day.
Why is this key sector so important to watch?
I find the most interesting aspect of the lagging IYT sector is that it may support the areas of inflation that have peaked due to demand falling. Lately, the words “demand destruction” has hit the media big time as the cure to inflation.
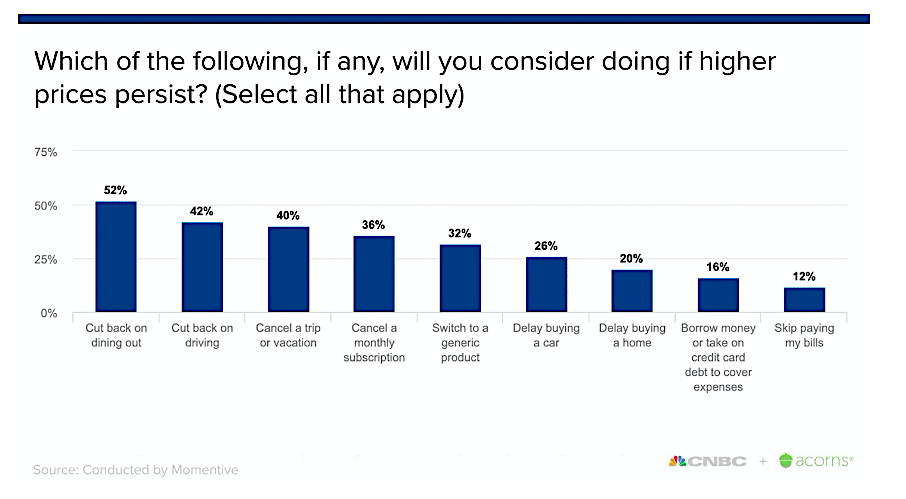
In the chart above provided by CNBC, a survey asked folks what they will cut back on if higher prices persist.
Dining out was number one. However, that will not do much for food prices, rather, it will just hurt restaurants. After all, people still must shop for food.
However, cutting back on driving, trips, buying homes and cars will impact demand side for many businesses.
Wil it cure inflation? That remains to be seen. But it can surely keep the other buzzword we are hearing all the time alive, “recession.”
The chart of IYT (daily and weekly) reflects what could continue to keep any rallies short-lived.
The weekly chart is the most interesting. While Retail (XRT) never broke below its 200-WMA, IYT cannot find the legs to get back over it.
On the daily chart, the real motion indicator (bottom chart) shows a mean reversion in momentum. Yet, the leadership indicator reflects IYT weakness against the S&P500.
And the price illustrates some indecisiveness at current levels. If IYT holds above 209.90 then a reversal trade remains possible.
However, if IYT cannot clear the 200-WMA at 211.90, then that reversal potential cools. And most likely, the rally in the rest of the market will cool as well.
Perhaps this is the best way to measure how far-reaching consumer demand destruction will continue to play out. And along with that, how much inflation has really peaked.
The economic modern family continues to offer us a reliable way to see how the key sectors reveal the current macro landscape. After all, price always pays.
Stock Market ETFs Trading Analysis & Summary:
S&P 500 (SPY) 380 resistance 374 pivotal support 360 major support
Russell 2000 (IWM) 159 support 175-177 big resistance
Dow Jones Industrials (DIA) 294 support 300 pivotal
Nasdaq (QQQ) 290 resistance 263 big support
KRE (Regional Banks) 56 the 200 WMA 60 resistance
SMH (Semiconductors) 195 some minor support with 220 resistance
IYT (Transportation) 211.90 the 200-WMA resistance 192 support
IBB (Biotechnology) Still potential double bottom-110 pivotal-112.50 resistance
XRT (Retail) 60.62 the important 200-WMA support with resistance 62.75
Twitter: @marketminute
The author may have a position in mentioned securities at the time of publication. Any opinions expressed herein are solely those of the author and do not represent the views or opinions of any other person or entity.

: Worrisome to Broader Market?")

