The steady-state, 3%-per-month melt-up that is 2013 year-to-date continues apace for the S&P 500 (symbol: SPX).
Back in late March with the S&P just off October 2007’s then all-time highs, we subjected what Josh Brown has insightfully coined “The Impossible Rally” to yet another stress test, evaluating the long trend’s structural integrity with harmonic patterns. We found the broad uptrend in US stocks at a major inflection point: not simply because of proximity to the all-time high, but because the harmonic relationships constructed throughout the entire 2007-2013 round trip added up to a cyclical fork in the road several years in the making. As we’ll see in a moment, the resolution of that inflection point was decisive.
After counter-arguing the tireless up-trend to see how it was holding up back then, we noted:
“If the S&P 500 does move to 1600, unless full capitulation markers are present it will probably move substantially higher: the next major cluster of resistance over S&P 1580 lies around 1700.”
Four months and 10% later, the S&P is knocking on 1700 and it’s that time again. With this round, our review gets more granular: in what follows, you will first find an overview of the S&P 500 itself, then a comprehensive review of its sector components; and finally a few leading industry charts thrown in for good measure.
The basic market assessment alluded to in the quote above is basically unchanged: the S&P 500 is sprinting headlong into an area its harmonic structure suggests could pose significant resistance: generally between 1700-1760; and more specifically +1-1.5% above Friday’s close at 1700-1715; or +3.5-4.5% higher at 1745-1760.
This is not intended to forecast or denote a market top; the breakout above 2007’s all-time highs despite a credible argument against it is instructive on that point. Like last time, these charts are intended to shed light on where a broad market pullback or major consolidation may next occur by not only examining the index itself, but by also “taking a look under the hood” at the S&P’s sector-level makeup.
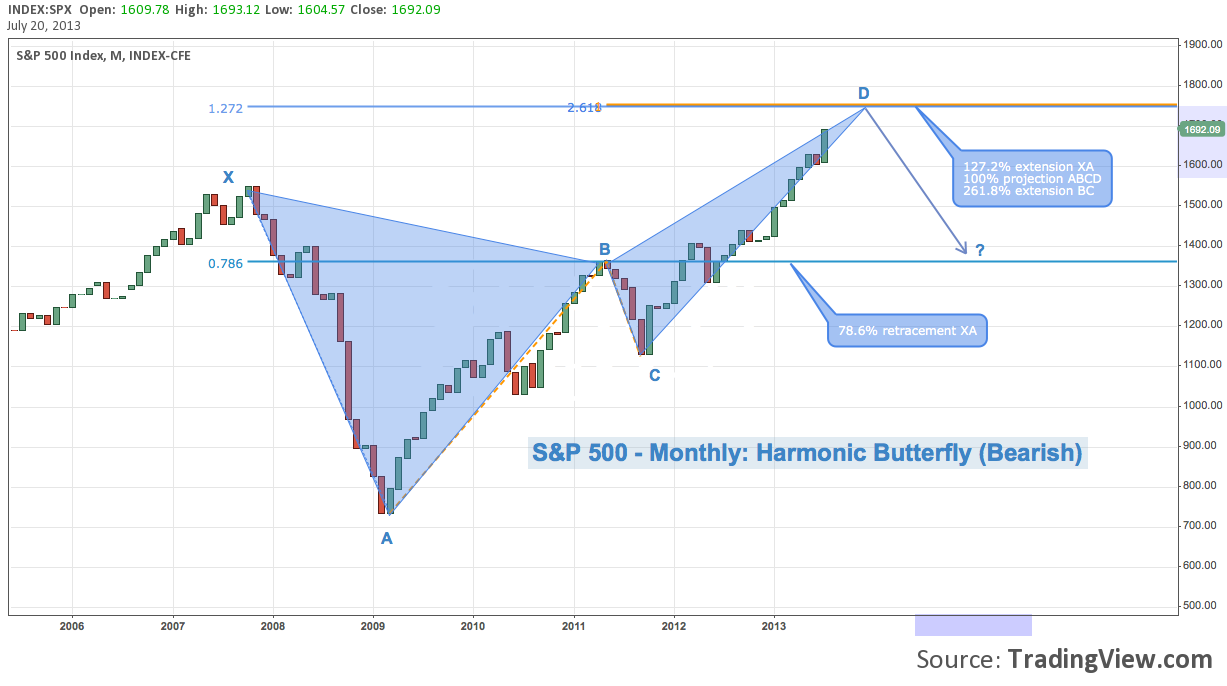
S&P 500 (SPX) – Monthly Harmonic Pattern
The S&P is winding out a massive monthly Butterfly incorporating the 2007 high-to-2008 low, and a BC leg covering the July-October 2011 correction that followed in the wake of the debt ceiling debate and S&P’s US downgrade to AA+. Along with a full measured move off the 2009 low, these points project PRZ (potential reversal zone) around 1750.
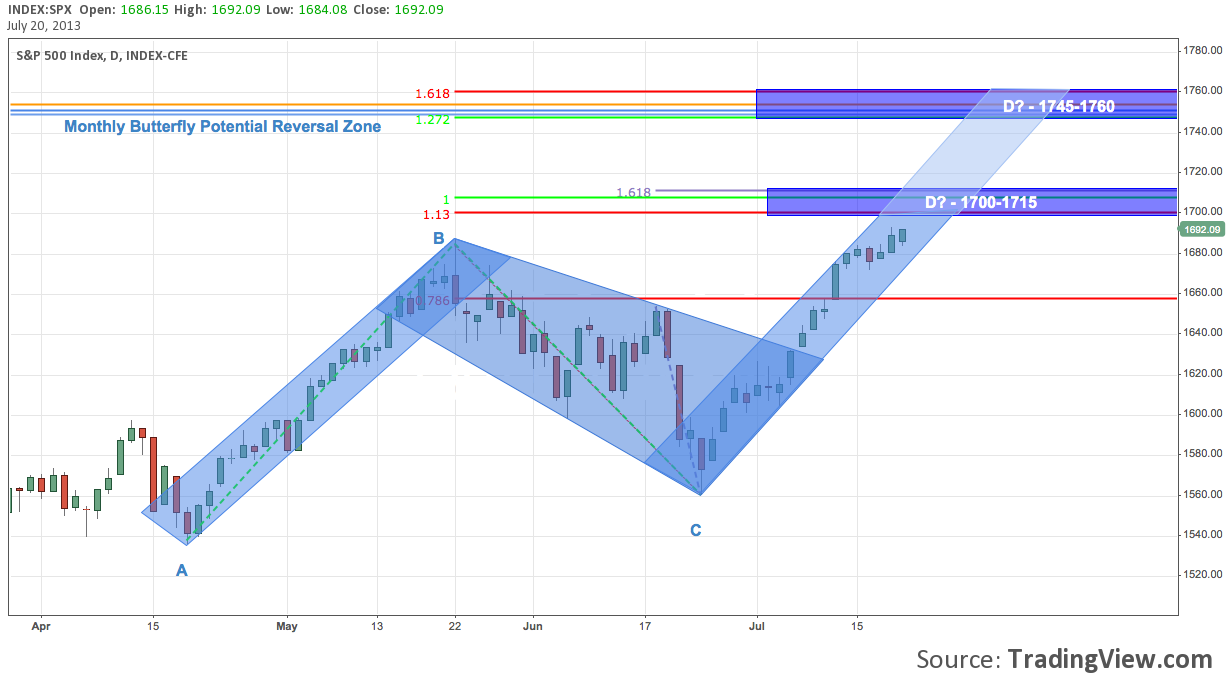
S&P 500 (SPX) – Daily Harmonic Pattern
Zooming in on the index’s daily timeframe to examine the potential topping microstructure of the monthly pattern (a process we’ll follow in most cases below), we find a harmonic ABCD off the mid-April bottom. This pattern provides the general framework for the 1700-1760 window mentioned above: 1700-1715 and 1745-1760, where the latter PRZ coincides with the monthly butterfly’s. Both levels are significant, but the second has much greater technical implications for “The Impossible Rally”.
Now we’ll turn to each the S&P’s 9 sector components in turn, following the paradigm above by looking at both the monthly and daily in most cases and letting the charts do most of the talking. Like the S&P itself, each sector features a harmonic structure on the monthly and/or daily. While most or all of them may not activate, their prevalence validates the 1700-1760 area on the S&P as a zone of concern.
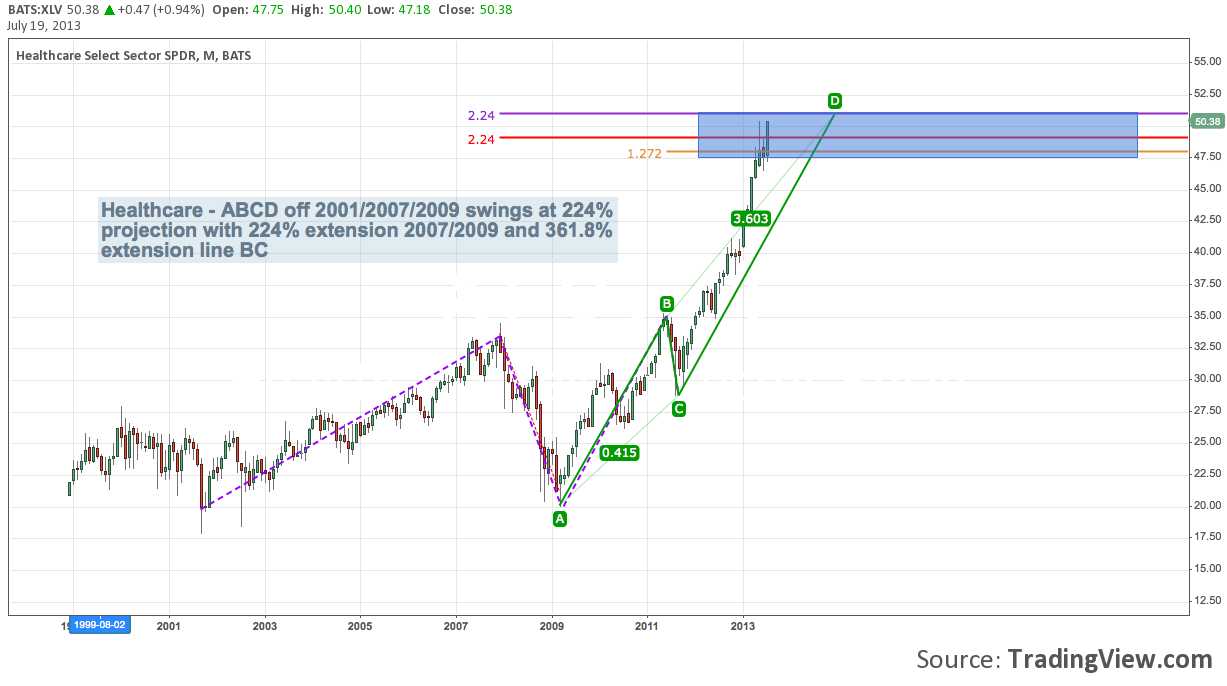
Healthcare (XLV) – Monthly Harmonic Pattern
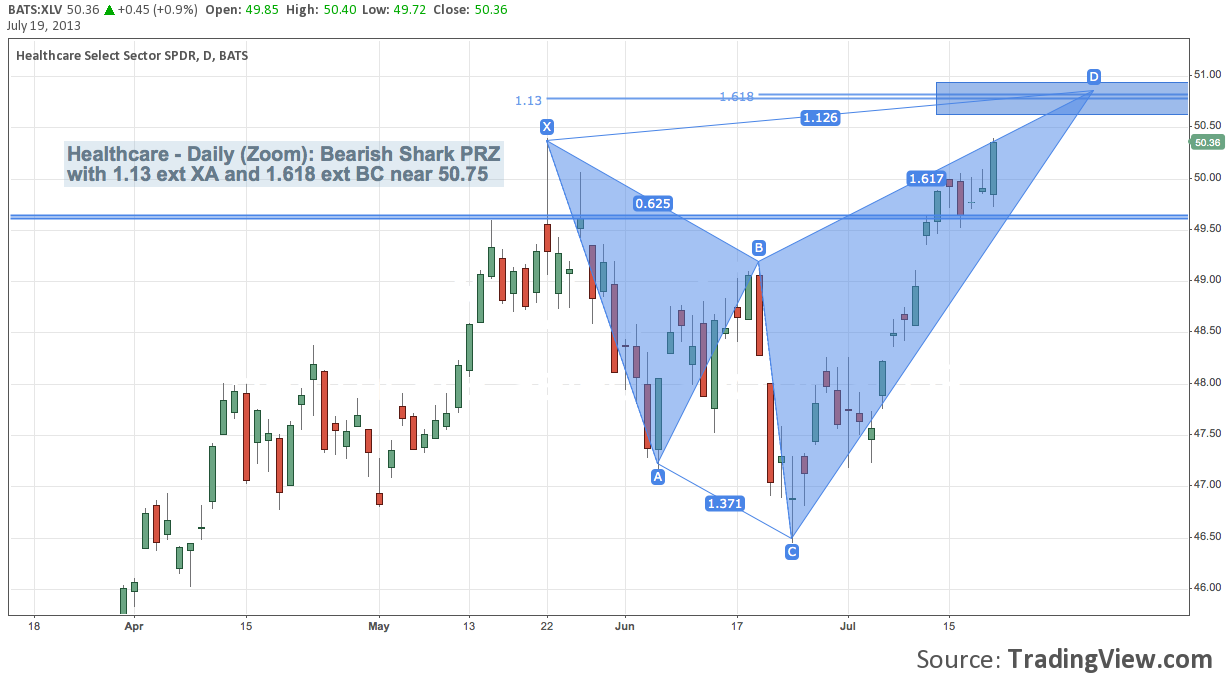
Healthcare (XLV) – Daily Harmonic Pattern
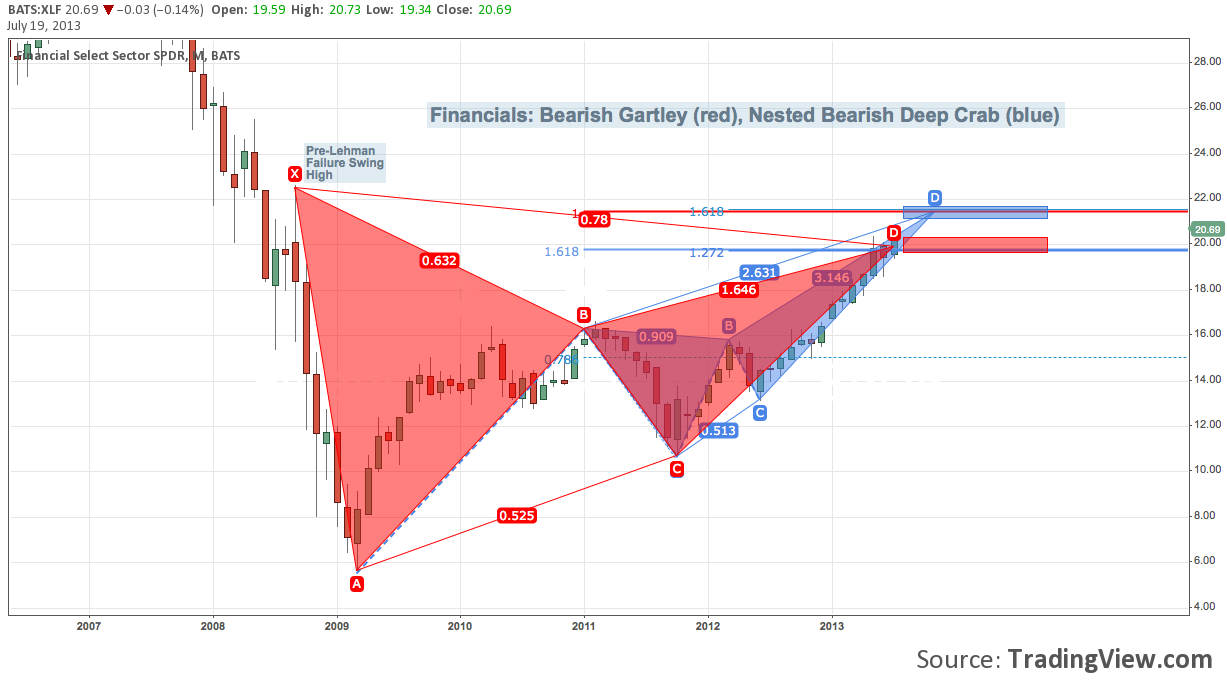
Financials (XLF) – Monthly Harmonic Pattern
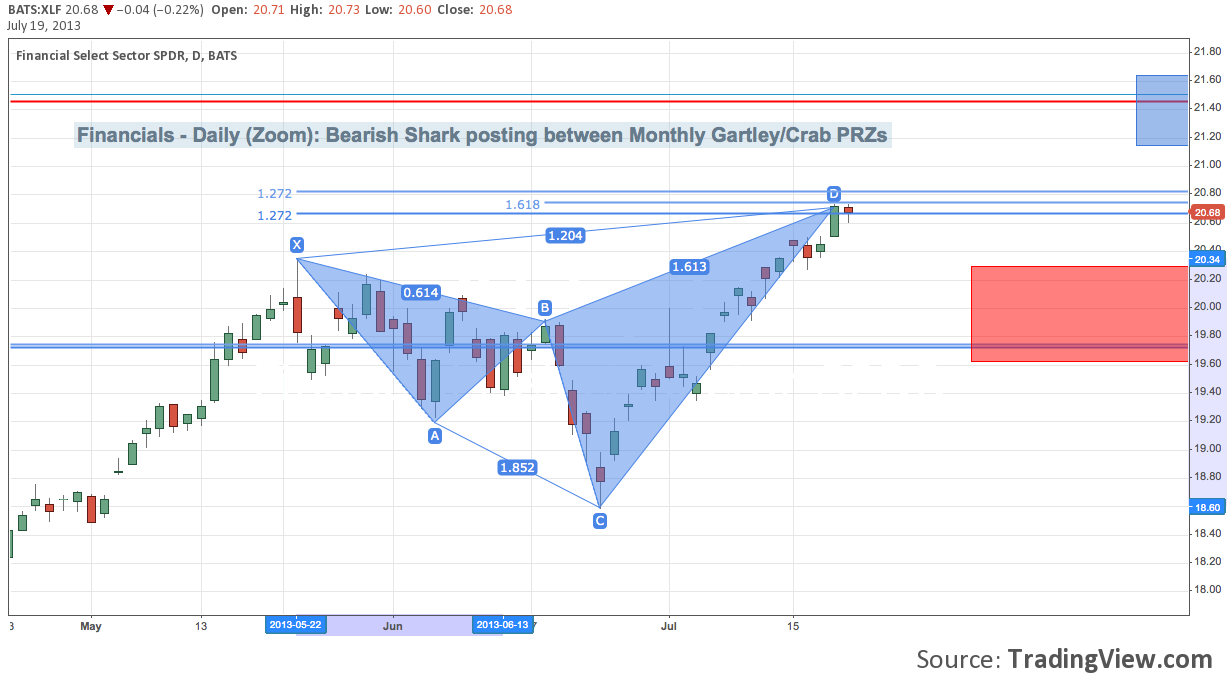
Financials (XLF) – Daily Harmonic Pattern
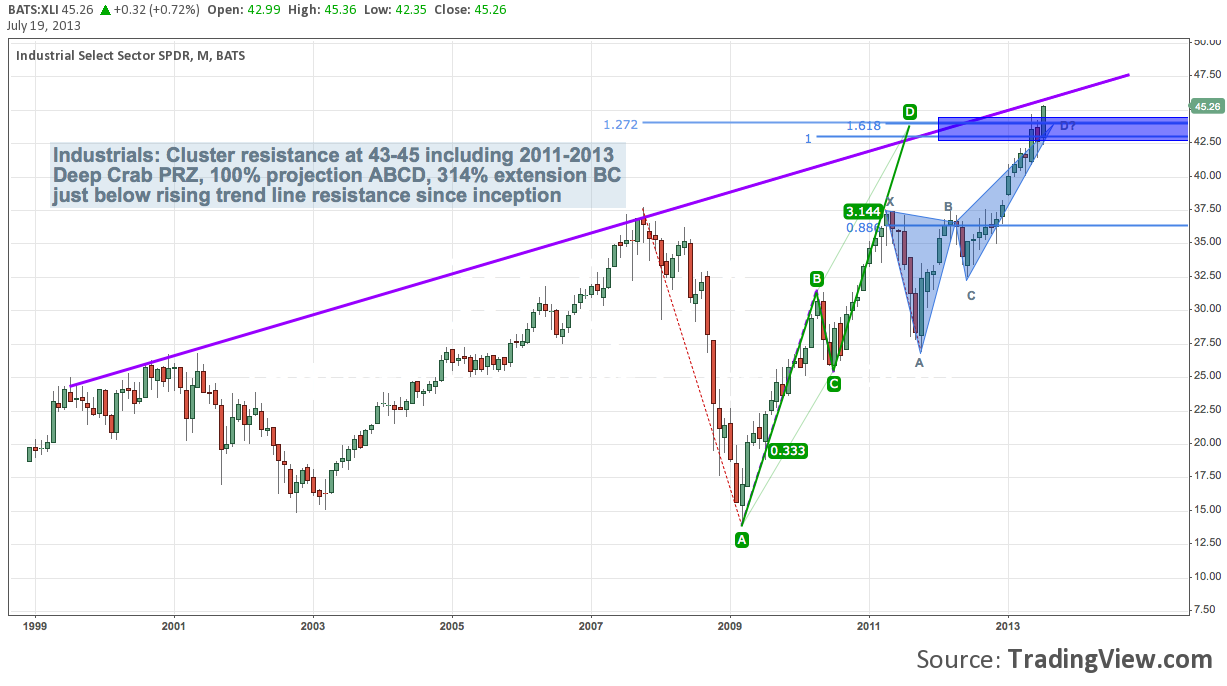
Industrials (XLI) – Monthly Harmonic Pattern
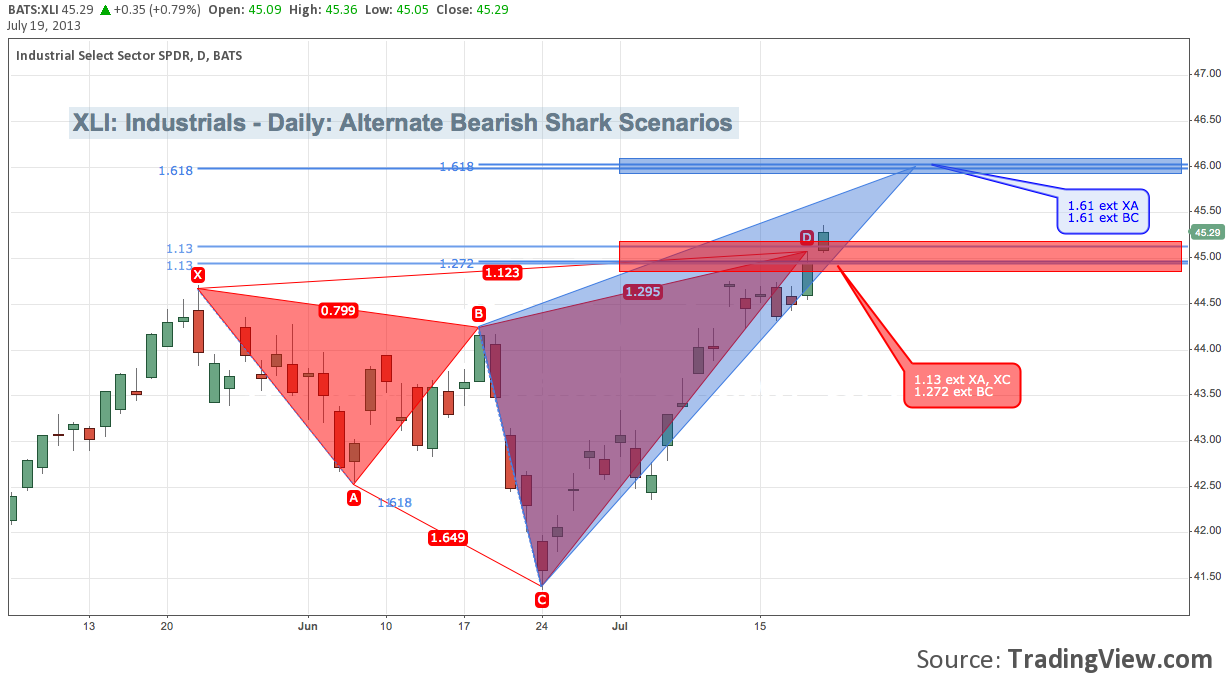
Industrials (XLI) – Daily Harmonic Pattern
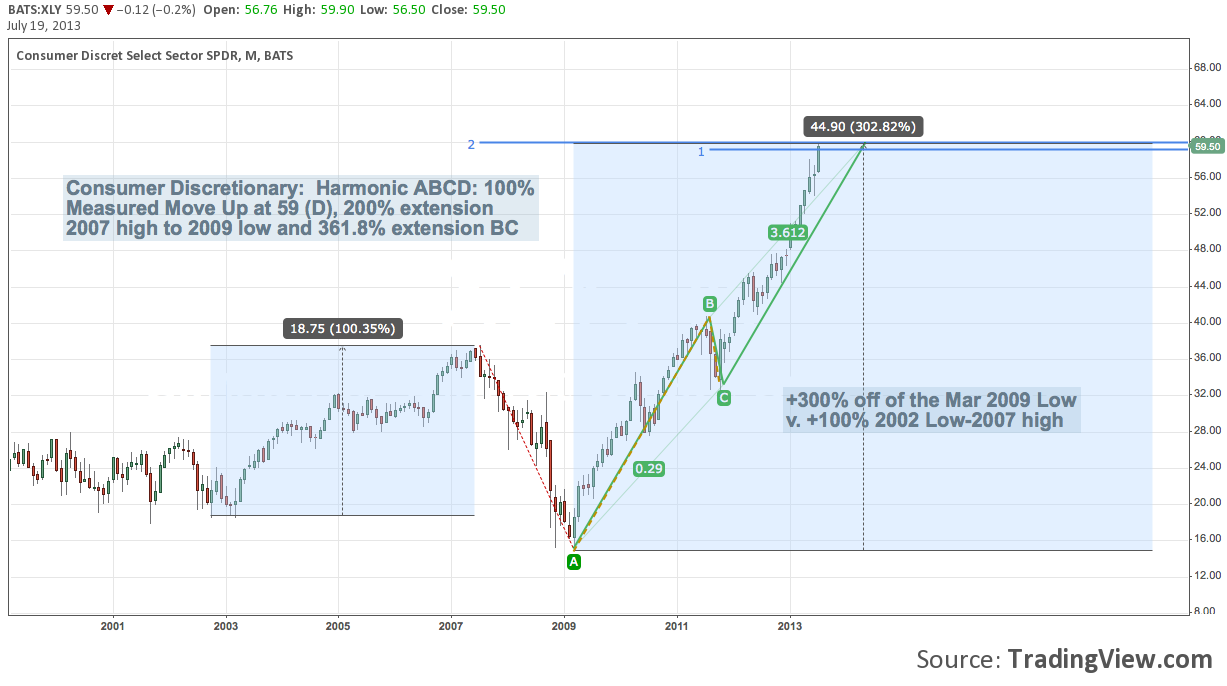
Consumer Discretionary (XLY) – Monthly Harmonic Pattern
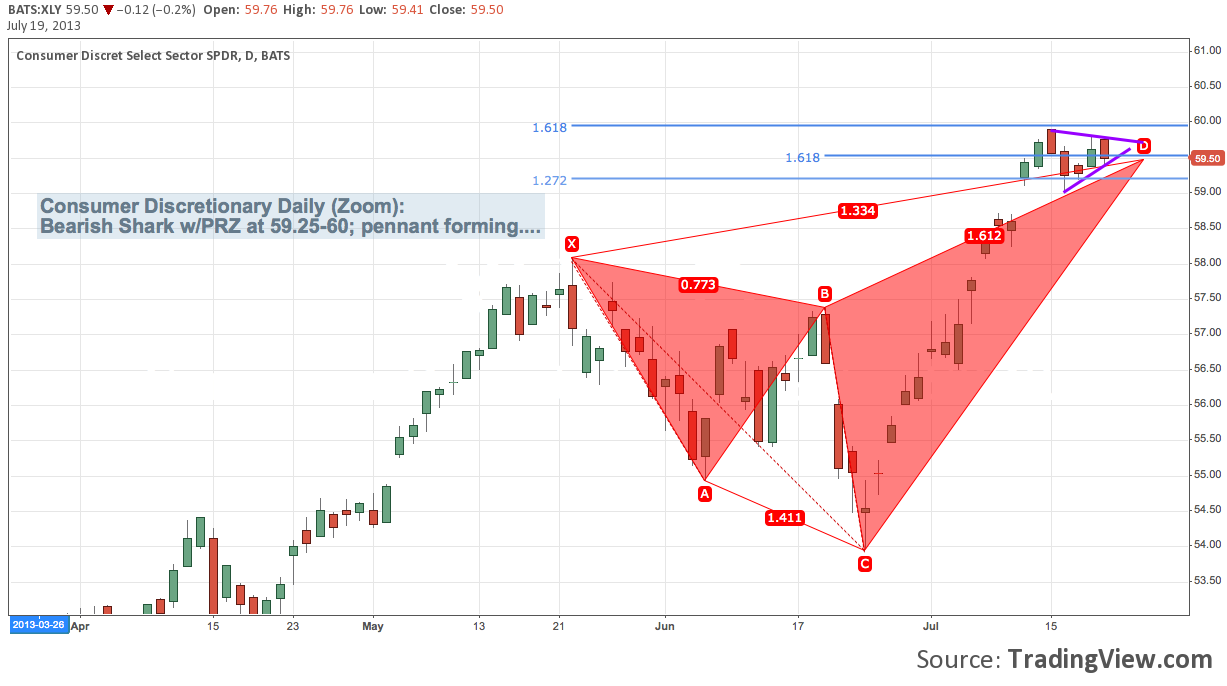
Consumer Discretionary (XLY) – Daily Harmonic Pattern
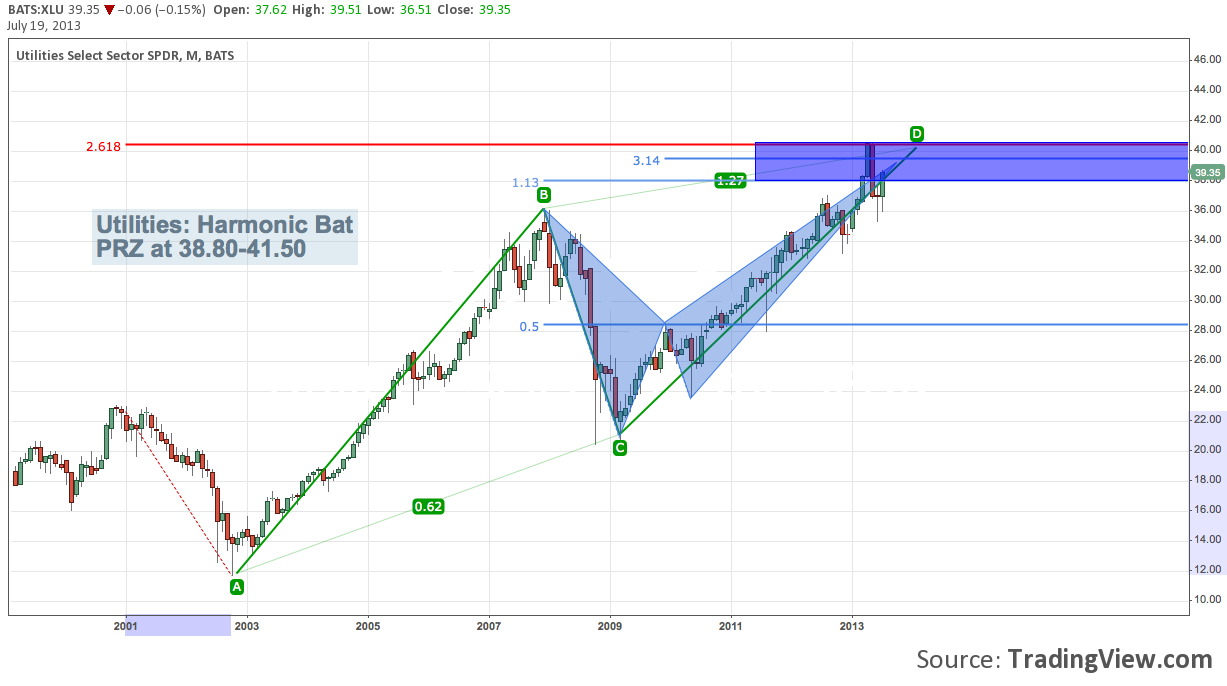
Utilities (XLU) – Monthly Harmonic Pattern
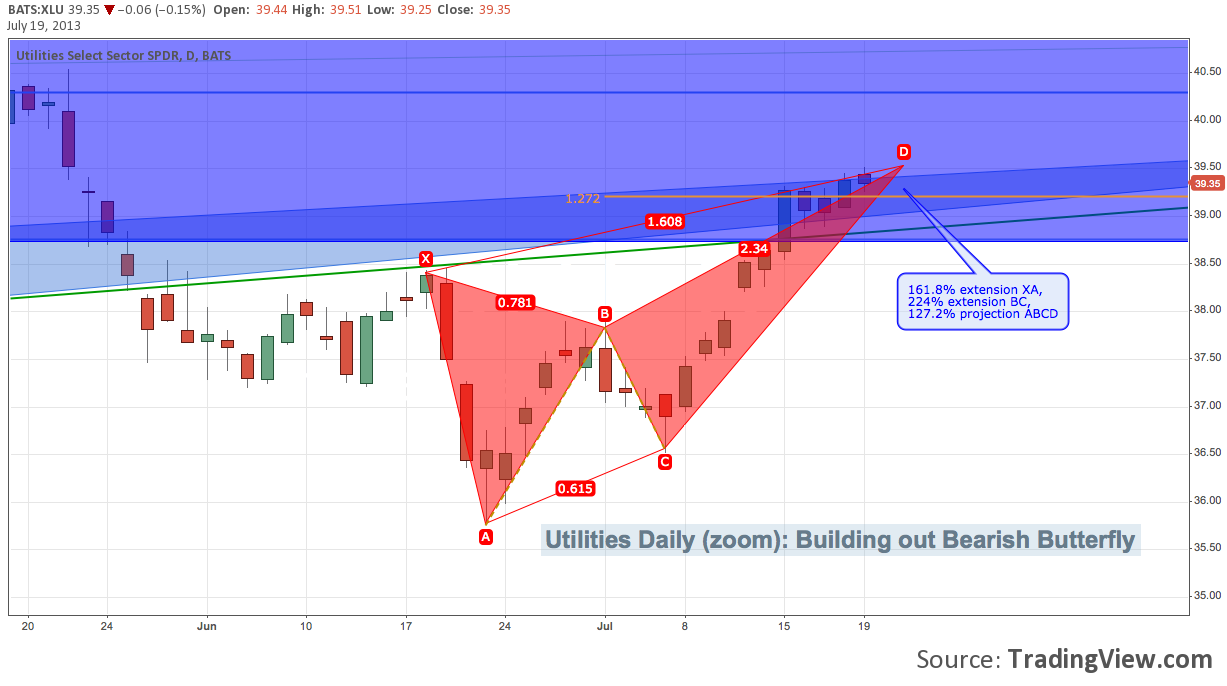
Utilities (XLU) – Daily Harmonic Pattern
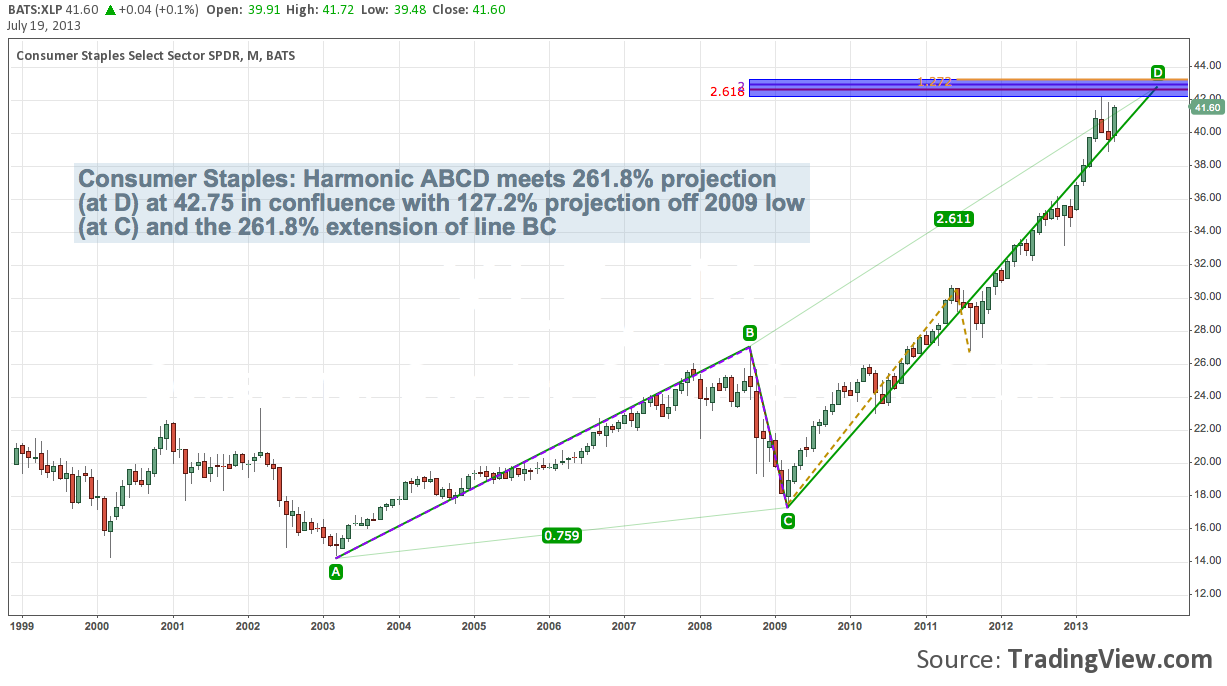
Consumer Staples: (XLU) – Monthly Harmonic Pattern
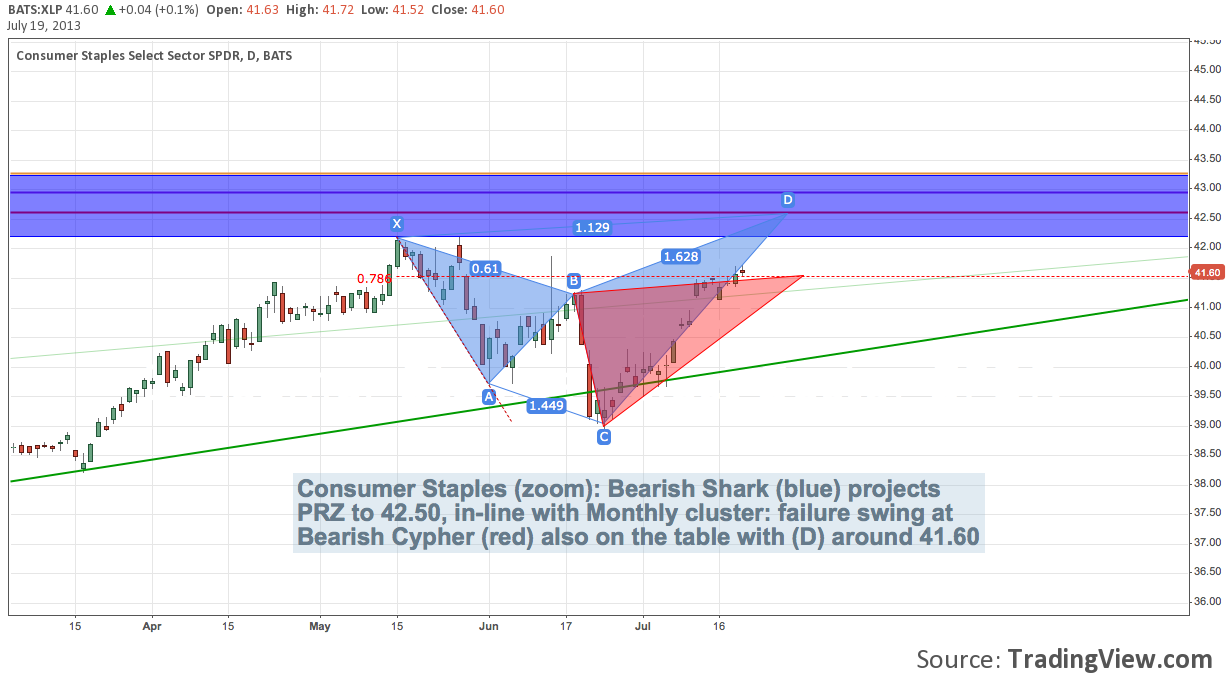
Consumer Staples (XLU) – Daily Harmonic Pattern
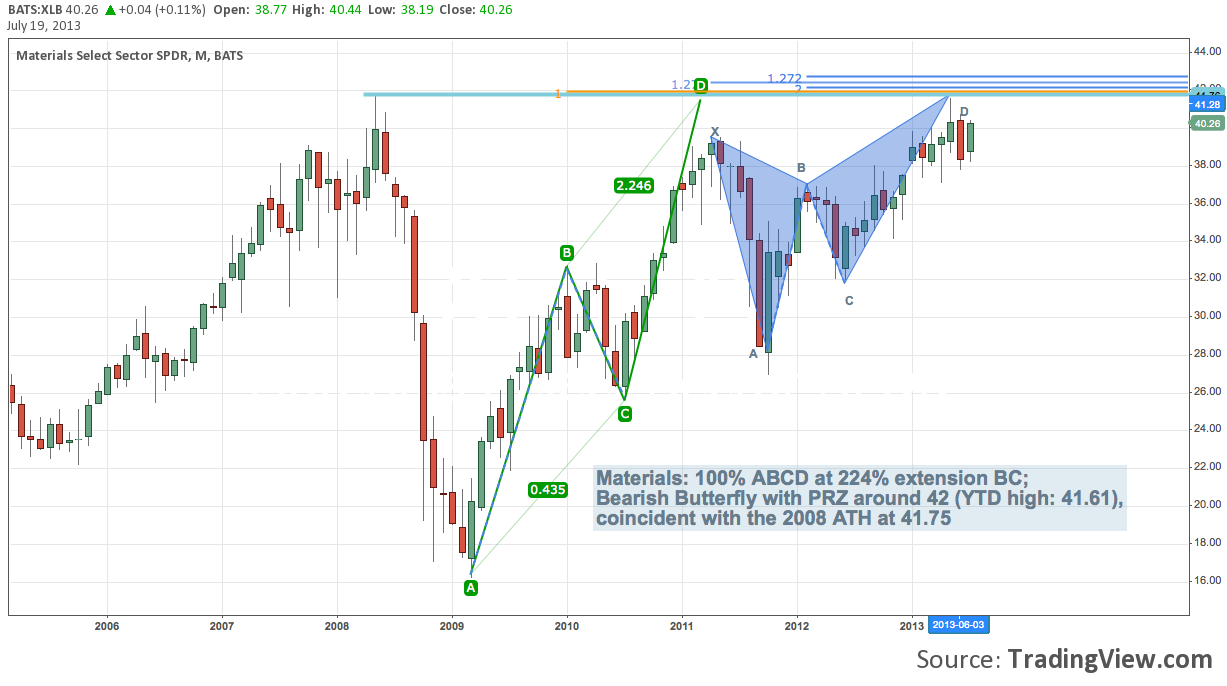
Materials (XLU) – Monthly Harmonic Pattern
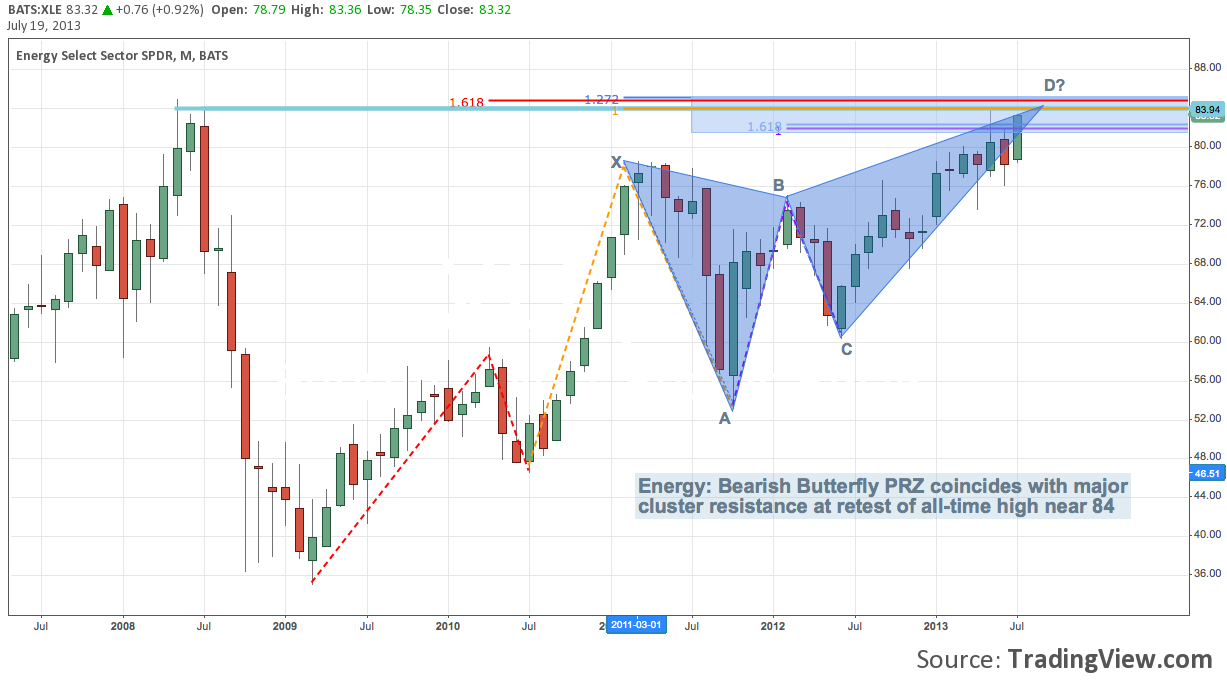
Energy (XLE) – Monthly Harmonic Pattern
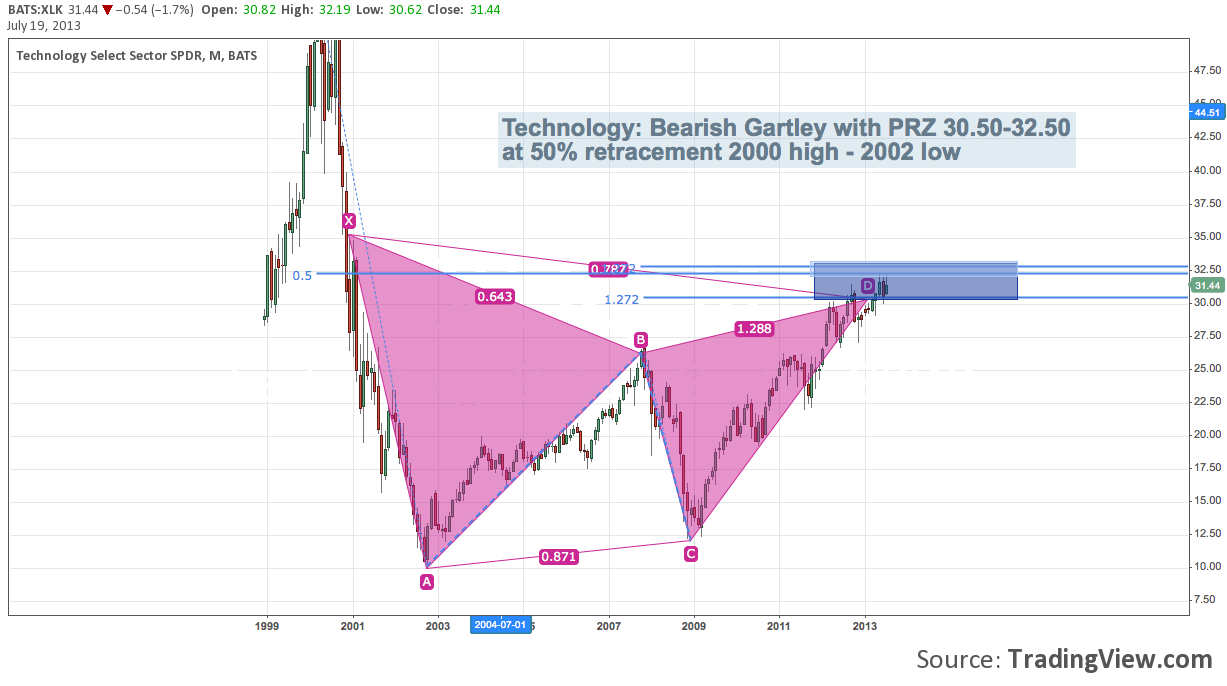
Technology (XLK) – Monthly Harmonic Pattern
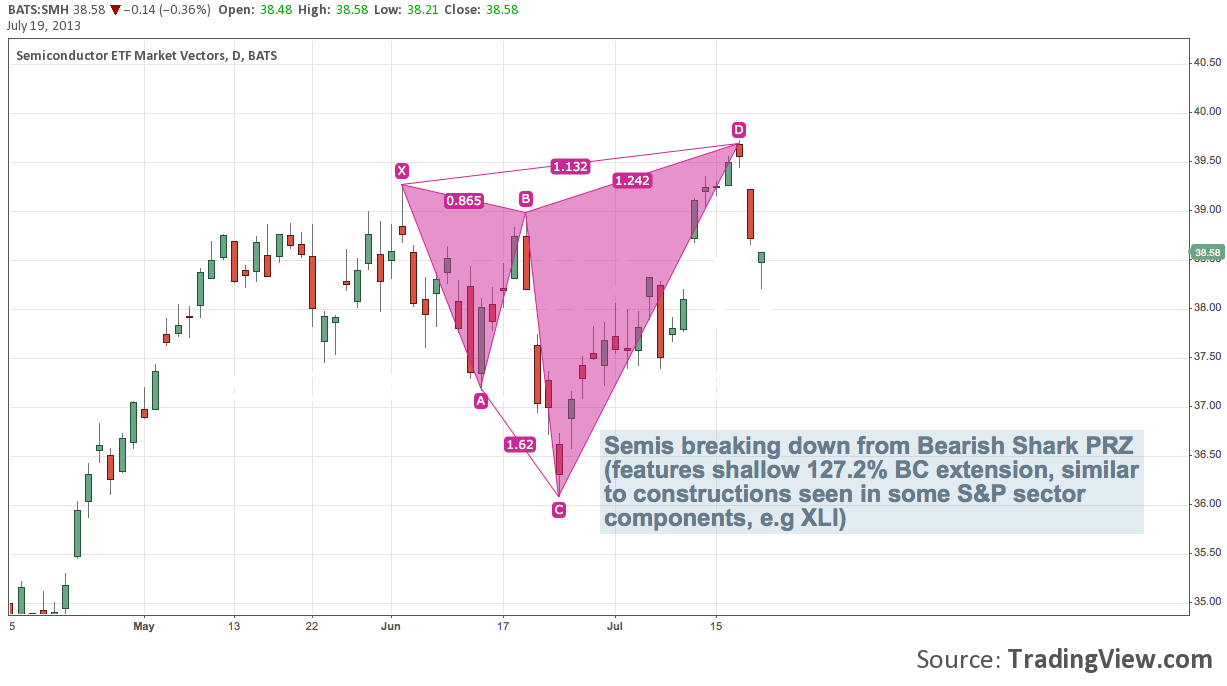
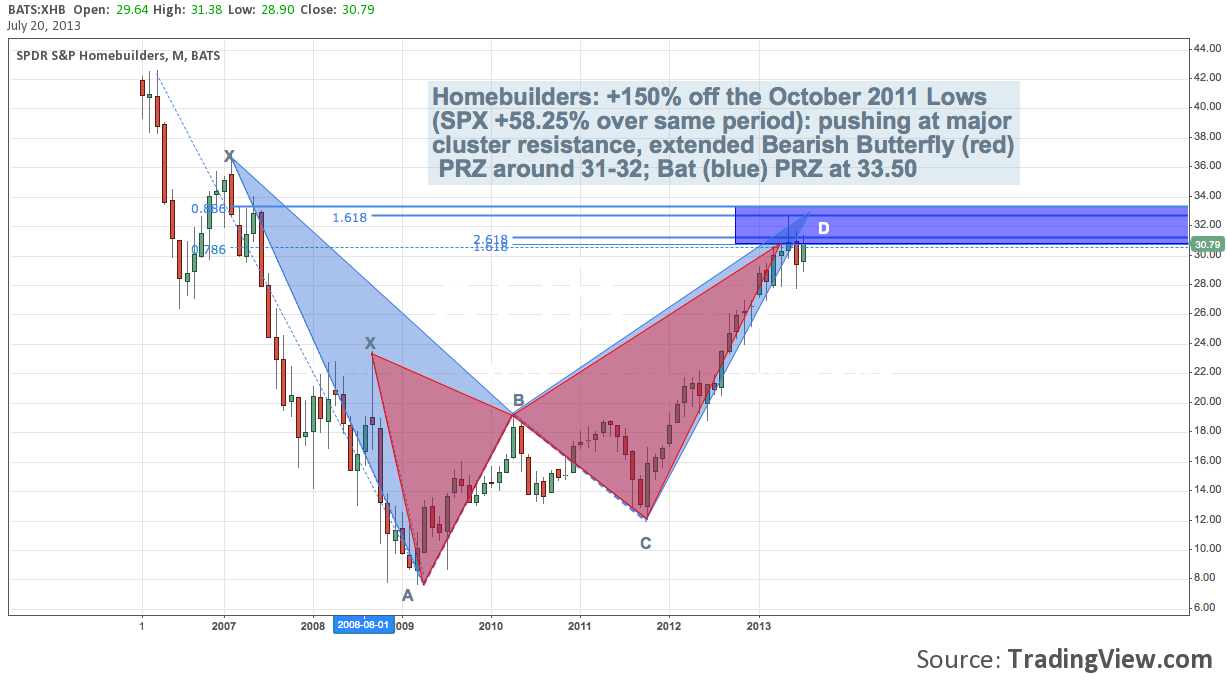
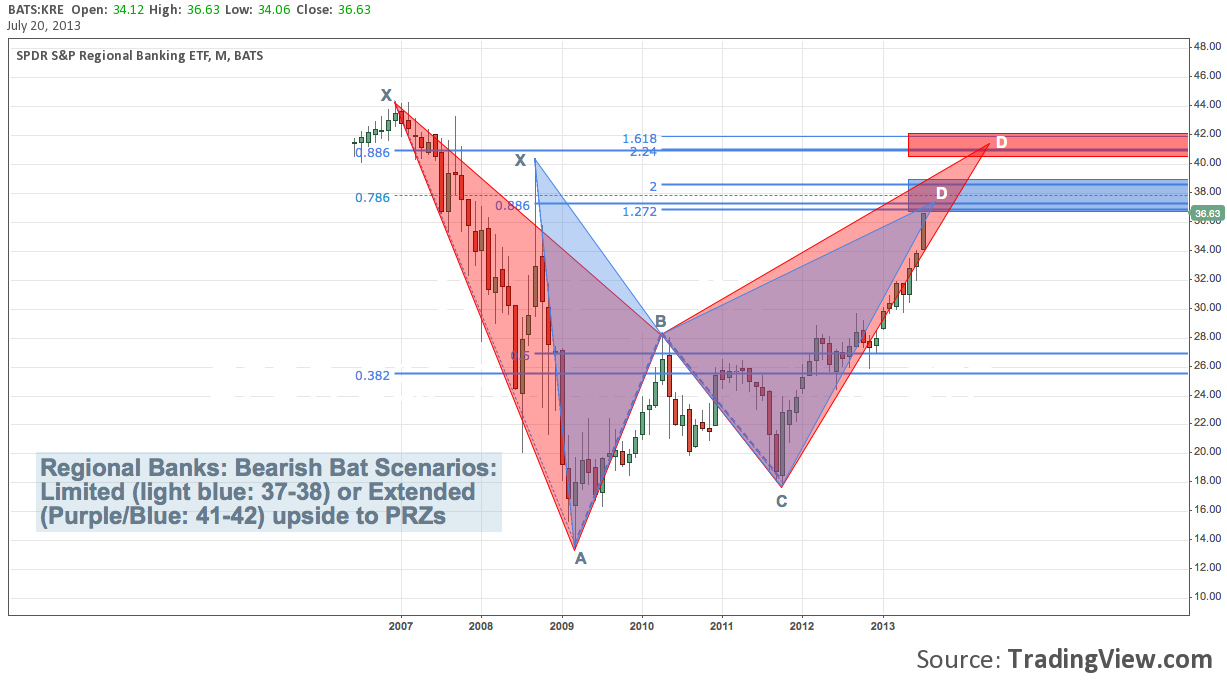
All sectors considered, here’s a brief look in on a few leading industries:
Semis (SMH) – Daily Harmonic Pattern
Homebuilders (XHB) – Monthly Harmonic Pattern
Regional Banks (KRE) – Monthly Harmonic Pattern
Twitter: @andrewunknown and @seeitmarket
No position in any of the mentioned securities at the time of publication.
Any opinions expressed herein are solely those of the author, and do not in any way represent the views or opinions of any other person or entity.

: Showing Some Signs of Emerging Strength")
