The following is a recap of the December 23 COT Report (Commitment Of Traders Report) released by the CFTC (Commodity Futures Trading Commission) looking at COT data and futures positions of non-commercial holdings as of December 20.
Note that the change in COT report data is week-over-week. Excerpts of this blog post also appear on Paban’s blog.
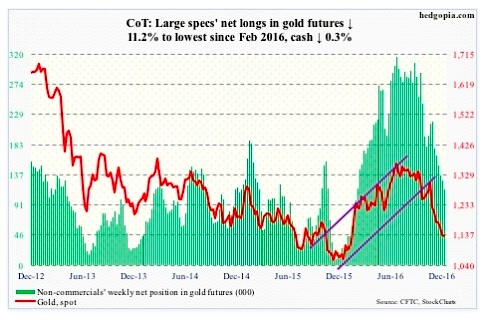
Gold
The SPDR Gold ETF (NYSEARCA:GLD), cannot catch a break. In the week ended Wednesday, it lost another $911 million (courtesy of ETF.com). This was the sixth straight week of redemptions, during which $5 billion was withdrawn.
This obviously has not helped the metal. Plus, non-commercials continue to cut back net longs.
The cash ($1,133.6/ounce) is grossly oversold on a daily and weekly basis, but support is not being defended. Gold bugs were unable to defend the .618 Fibonacci retracement of the November 30 (2015)-July 5 (2016) rally on the cash. That support lied at $1,172.3.
Shorter-term moving averages continue to drop. Ditto with the lower Bollinger band. If there is any consolation for the gold bugs, it is that last week’s low of $1,124.3 is holding, with sideways action in the subsequent six sessions.
December 23 COT Report: Currently net long 114.8k, down 14.5k.
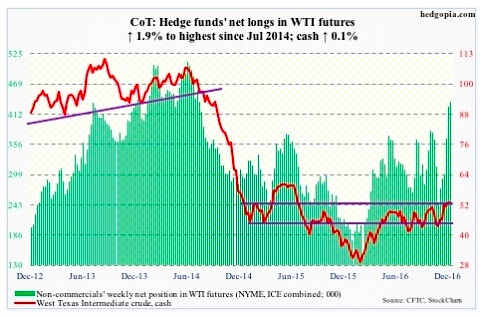
Crude Oil
Markets interpreted last Wednesday’s EIA report as negative. Spot West Texas Intermediate crude oil lost 1.5 percent in that session.
In the week ended last Friday, crude oil stocks did indeed rise 2.3 million barrels to 485.4 million barrels. As did crude oil imports, which increased by 1.1 million barrels per day to 8.5 mb/d – a seven-week high.
On the positive side, both gasoline and distillate stocks fell – by 1.3 million barrels to 228.7 million barrels and by 2.4 million barrels to 153.5 million barrels, respectively.
Crude production fell, too, but just by 10,000 b/d to 8.8 mb/d. And refinery utilization rose one percentage point to 91.5 – a 13-week high.
Coming into the week, spot WTI was beginning to look fatigued, with a long-legged weekly doji last week and a doji before that. This week produced another dojj. Since it bottomed in early February this year, it has more than doubled, and in the process has carved out a potentially bullish inverse head-and-shoulders pattern. Odds favor it does not complete – at least not in the near term.
December 23 COT Report: Currently net long 434.4k, up 8k.
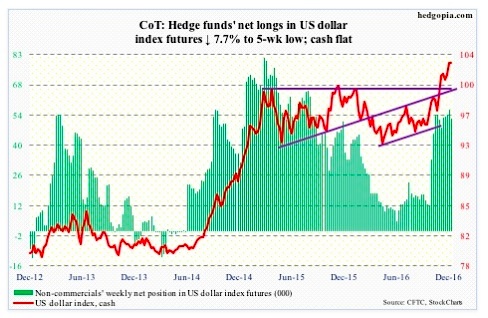
US Dollar Index
The US Dollar index peaked at 100.71 in March last year. That level was unsuccessfully tested in November that year, and later again this November. A breakout occurred on November 17. Successful breakout retest has taken place in the past four weeks. In fact, 102 is the new near-term support.
The US Dollar index had been rising since May this year. But post-election, the rally has taken a life of its own – up north of five percent. Dollar bulls accordingly have expended lots of energy on this.
Odds favor the afore-mentioned 102 support gets tested in the days to come – and possibly another retest of the November 17th breakout.
December 23 COT Report: Currently net long 52.4k, down 4.3k.
Thanks for reading.
Twitter: @hedgopia
Author may hold a position in mentioned securities at the time of publication. Any opinions expressed herein are solely those of the author, and do not in any way represent the views or opinions of any other person or entity.
: Creating Bullish Divergence?")


 and Semiconductors (SMH): Concerning Price Pattern?")


