If the recent bout of stock market volatility has you feeling bearish, we’d encourage you to wait for more evidence.
Today we look at the S&P 500 Index (NYSEARCA: SPY) as part 2 of our series (see part 1: the NYSE Composite trading forecast).
Thus far, the stock market correction looks very much like a correction should, on both an emotional and a technical level.
Here’s what we wrote yesterday about the correction:
Certainly the recent swings have made intraday trading feel at moments like drinking from a fire hose, and the quick moves can make it hard to spot safe entries on larger time frames too. From now forward, any bullish trades should be chosen very carefully and with smaller positions than usual.
But until we see a real breakdown of support, along with a series of lower highs and lower lows, the trend (the trader’s friend) is still upward.
Another development we would like to see before turning bearish on stocks would be for the bond markets to find stability. When it appears that the decline in bonds is finding an area to pause or correct upward, that will give markets more confidence in shifting assets from equities into bonds, which should contribute to an equity decline. That inflection might occur around March 2019 if the Fed continues raising interest rates as expected between now and then.
This is why we have been telling our clients not to jump onto bearish positions too quickly.
That said, the recent decline looked more like the end stage of a fourth-wave correction on the S&P 500 chart. Unlike the NYSE Composite (which we reviewed in Part I), the S&P 500 came off a higher high.
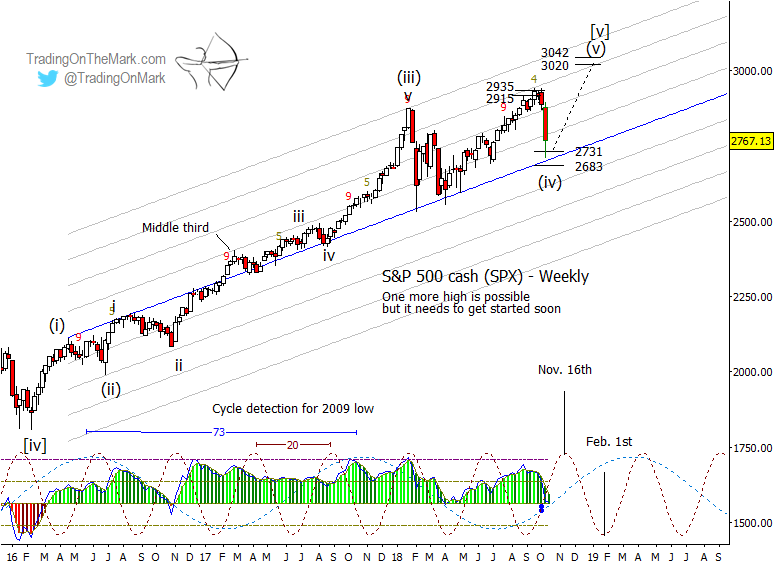
The decline stopped in the vicinity of supports based on Fibonacci extensions — an area that is also near a type of regression line that has coincided with price extremes during the past two years.
As with NYA, we will resist turning bearish unless those important supports fail.
Note also that both the 20-week and 73-week price cycles are now in their up-swing phase. November 16 and February 1 represent a timing areas to watch for inflections based on the faster cycle, but general cyclical influence should be upward for at least another month.
In volatile conditions, traders of all experience levels can benefit from charts that show the areas where turns are more probable. Trading On The Markhelps subscribers stay on top of the moves with twice-daily updates for the Dollar Index, Euro futures, the S&P 500, crude oil, treasury bonds, and gold. Between now and October 31, new subscribers can lock in savings of 15%on all of our services. The coupon code for the special offer is “fractal”.
Twitter: @TradingOnMark
The authors may have a position in the mentioned securities at the time of publication. Any opinions expressed herein are solely those of the author, and do not in any way represent the views or opinions of any other person or entity.


: Showing Some Signs of Emerging Strength")
