One of the best signals in markets?
When price reclaims the 50-day moving average.
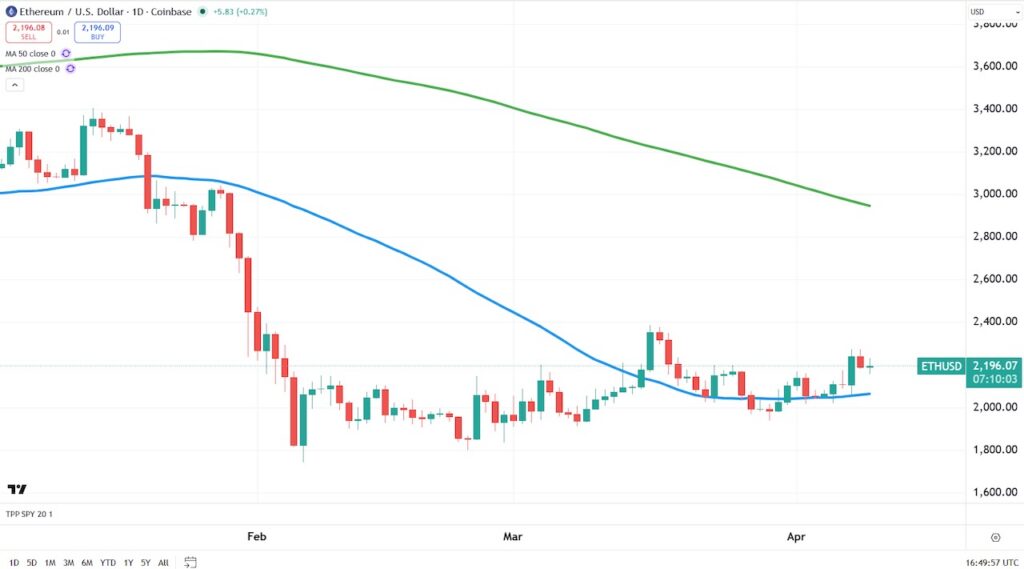
And right now—we’re seeing that setup in both Ethereum and Bitmine.
After spending an extended period trading below the 50-day,
both are now pushing back above it.
That’s not just a bounce—that’s a potential phase change.
From bearish… to recuperation.
Now here’s what makes this interesting.
The slope of the 50-day moving average is starting to flatten.
That tells us downside momentum is slowing.
And if that slope begins to turn up?
That’s when trends can build.
So what’s the trade?
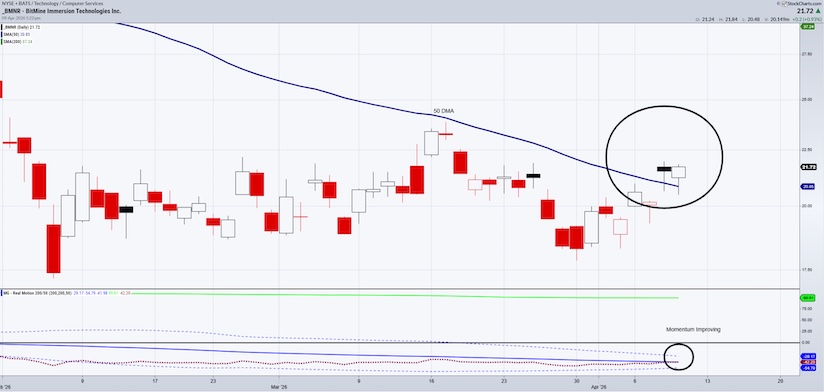
If Ethereum and Bitmine hold above the 50-day,
this becomes an actionable entry—with very tight risk.
Because if they fail back below it?
You’re out.
Simple. Defined. Disciplined.
Bottom line?
Watch the 50-day.
Because when price reclaims it—
that’s often where the next move begins.
Here is our latest EMF video
Twitter: @ecomodfam
The author may have a position in mentioned securities at the time of publication. Any opinions expressed herein are solely those of the author and do not represent the views or opinions of any other person or entity.


 and Russell 2000 (IWM)")
 and Russell 2000 (IWM)")


