Rising oil prices have been the face of inflation, as everyone sees (and feels) the pain at the gas pump.
So what’s next for crude oil?
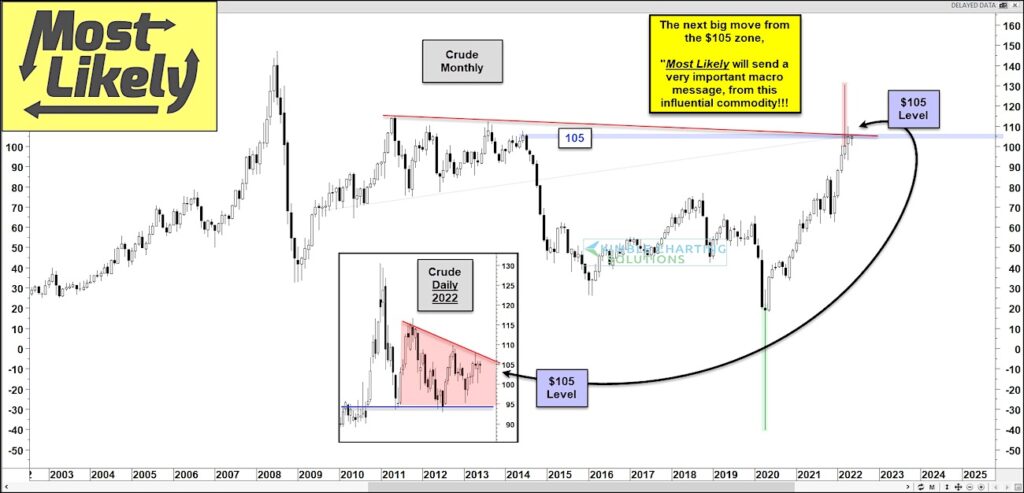
Today we look at the long-term “monthly” chart of crude oil and highlight a key level for investors to focus on into month-end.
We can see the recent spike higher reversed and closed back under $105. And now price is back trading in and around $105.
So what makes $105 important? Just take a look at the blue line (drawn from the prior top – at $105) and the red line drawn from the two prior highs (which currently intersects price at $105).
Needless to say, crude oil is a major macro indicator and input to the global economy. And I cannot help but think that how crude oil fares into month end – in regards to $105 – will be very important to stocks, bonds, commodities, and the economy. A close and breakout above $105 or a close move further below $105? Stay tuned!
Crude Oil “monthly” Price Chart
Note that KimbleCharting is offering a 2 week Free trial to See It Market readers. Just send me an email to services@kimblechartingsolutions.com for details to get set up.
Twitter: @KimbleCharting
Any opinions expressed herein are solely those of the author, and do not in any way represent the views or opinions of any other person or entity.

: Worrisome to Broader Market?")

