The following chart and data highlight non-commercial commodity futures trading positions as of March 13, 2017.
This data was released with the March 16 COT Report (Commitment of Traders). Note that these charts also appeared on my blog.
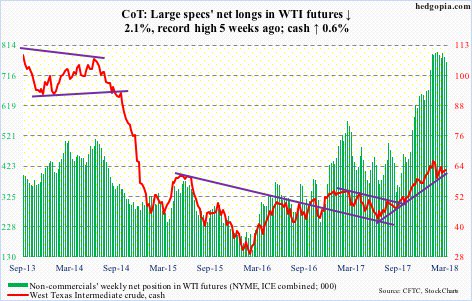
The chart below looks at non-commercial futures trading positions for Crude Oil. For the week, Crude Oil traded higher by +0.6%.
Crude Oil Futures
March 16 COT Report Spec positioning: Currently net long 758.7k, down 16.6k.
On Wednesday, the day the EIA report for the week ending March 9 was out, oil bulls defended short-term support at $60/barrel on spot West Texas Intermediate crude oil.
Crude oil continues to trade around the 50-day moving average; in fact, it closed out the week right under ($62.66). This level also approximates a falling trend line from early last month. This is an opportunity for the bulls to break a month-and-a-half-long pattern of lower highs. A failure will bring $60 into play again. After that, there is support at $58-59. The latter is a must-hold.
In the said week, crude oil production increased another 12,000 barrels per day (b/d) to 10.4 million b/d. Crude stocks, too, rose, up five million barrels to 430.9 million barrels.
Crude imports, however, dropped 418,000 b/d to 7.6 mb/d. Ditto with gasoline and distillate stocks – down 6.3 million barrels and 4.4 million barrels to 244.8 million barrels and 133.1 million barrels, respectively. Refinery utilization rose two percentage points to 90 percent.
Twitter: @hedgopia
Author may hold a position in mentioned securities at the time of publication. Any opinions expressed herein are solely those of the author, and do not in any way represent the views or opinions of any other person or entity.


