The past two weeks have been very bullish for crude oil prices, with prices rising from a low of 50.60 to as high as 59.93 this week.
But that picture changes as we zoom out and broaden our timeframes.
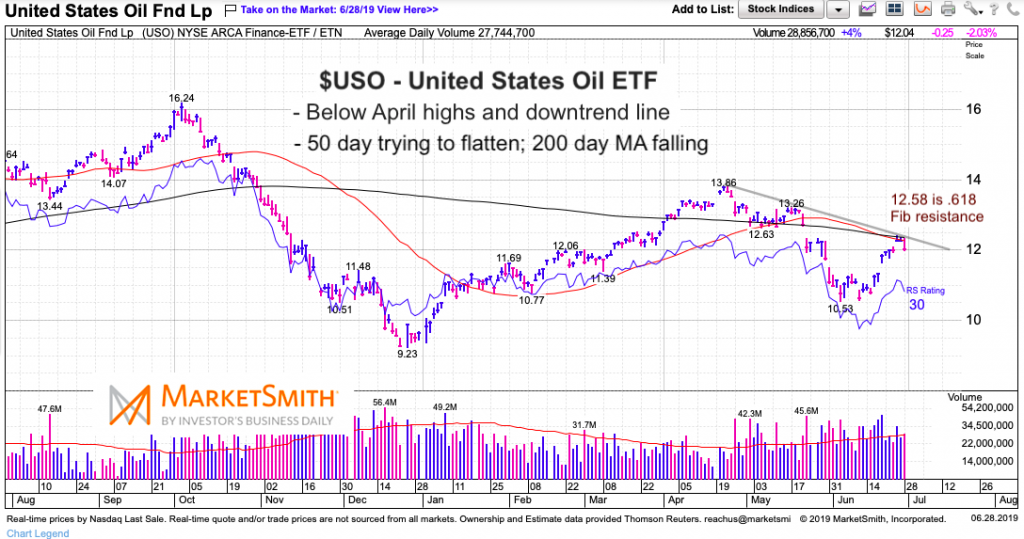
Crude oil WTI futures, as well as the United States Oil ETF (NYSEARCA: USO), hit strong price resistance mid-week and slipped a bit into week’s end. That resistance is made up of moving averages, and a Fib and downtrend line. As well, Crude is well below its April highs.
Today, we take a closer look at a chart of $USO.
Note that the following MarketSmith charts are built with Investors Business Daily’s product suite.
I am an Investors Business Daily (IBD) partner and promote the use of their products. The entire platform offers a good mix of technical and fundamental data and education.
United States Oil ETF “daily” Chart
As you can see, $USO is below its 50 and 200 day moving averages (MAs). And both MAs are falling.
These MAs are converging and worked in concert with an important Fibonacci level (.618) and downtrend line to reject $USO. A breakout over this resistance would be short-term bullish and likely lead to a retest of the May highs (and possibly the April highs). Next week will be important in determining what’s next for traders.
Twitter: @andrewnyquist
The author may have a position in mentioned securities at the time of publication. Any opinions expressed herein are solely those of the author, and do not in any way represent the views or opinions of any other person or entity.


 and Russell 2000 (IWM)")
