A swift 13 percent decline in WTI Crude Oil has grabbed investors attention.
And this shows how quickly sentiment can change.
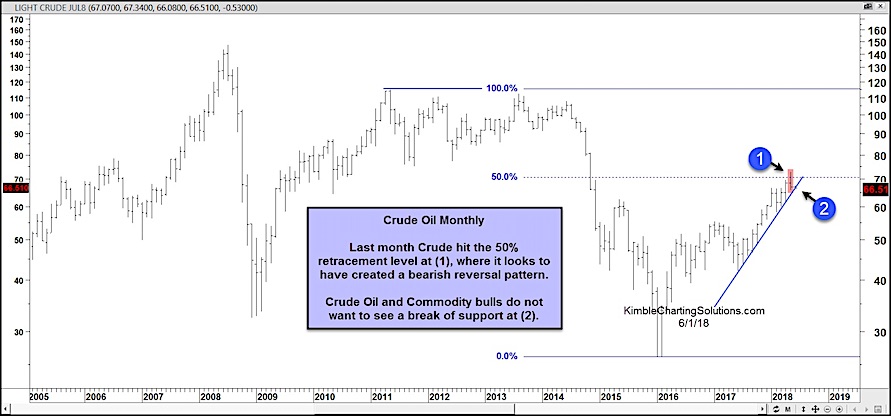
WTI Crude Oil has been in a strong uptrend now for several months. You can see this in the chart below.
While many are blaming supply headwinds from the Permian basin, the pullback can be explained via chart patterns and price action as well.
Looking at the “monthly” chart below, we can see that Crude’s bearish price reversal came at the 50 percent Fibonacci retracement level (point 1). Crude Oil also formed an RSI (Relative Strength Index) divergence – momentum was waning as prices hit new highs.
So what’s next? Well, price is currently testing the all-important rising trend line (2). Crude oil and commodity bulls do not want to see this support line break. The stakes are increasing for bull and bears – stay tuned!
Crude Oil Futures Long-Term Chart
Thanks for reading.
Twitter: @KimbleCharting
Any opinions expressed herein are solely those of the author, and do not in any way represent the views or opinions of any other person or entity.


