Crude Oil has seen some wide swings in 2016, with the latest one to the upside. There are some very interesting dynamics present on the charts, so I thought we’d discuss in depth today.
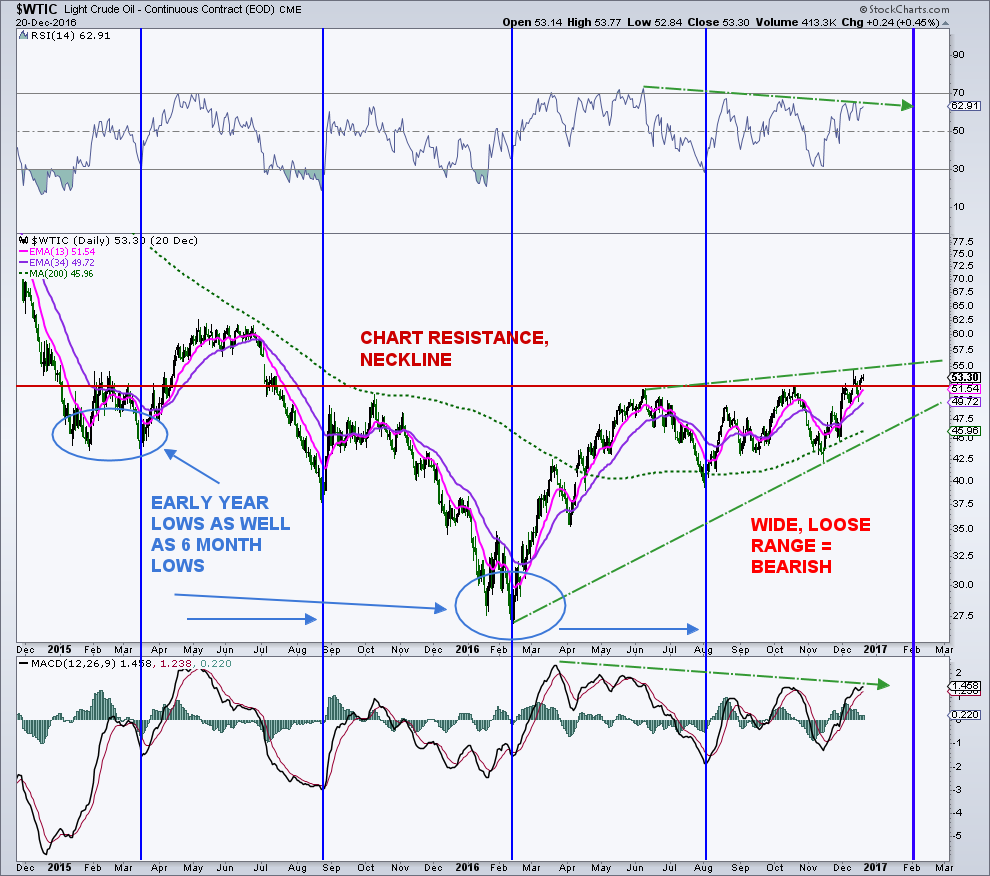
First off, its hard to argue that the price chart is bearish. Crude oil is trying to break meaningfully above chart resistance and the neckline of a large inverse head-and-shoulders pattern in the $52.20 area. As long as price remains above the neckline, crude is in decent shape.
However, there is a pretty good pattern of crude oil cycle lows every 6 months. And, as well, there is a pattern of seeing cycle lows early in the year. Note the bottoms in early 2015 and 2016. One thing I do not like about the price action is that the recent base was very wide and loose. It was over $10 at one point or 20% based on price.
It has narrowed, but in general, wide, loose bases are not bullish nor are they stepping stones for massive rallies. Note that the recent price highs have not been confirmed by daily momentum.
Crude Oil Technical Chart Analysis
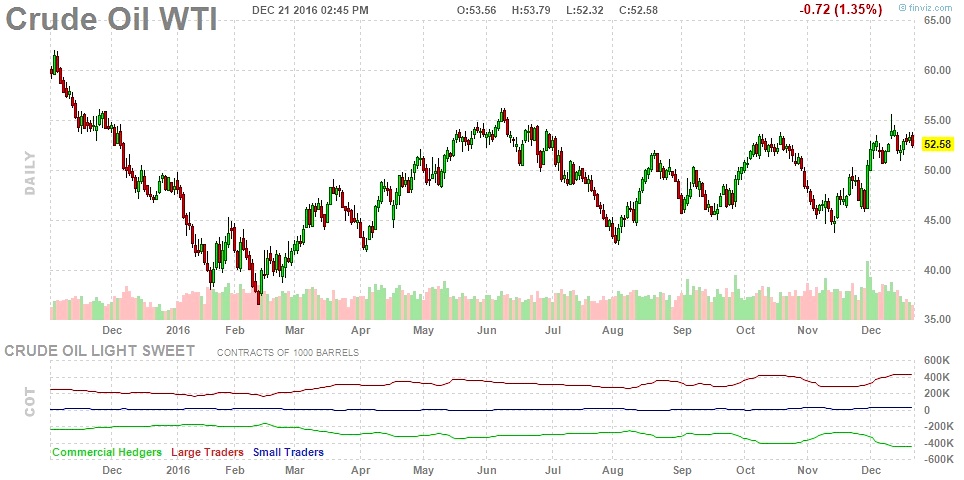
Over the past 10 years, it has been rough sledding for crude oil in January. The market has been down 80% of the time with an average loss over those 10 years about 3.1%. But, what really has us concerned dsis the Commitment of Trader’s (COT) data. In recent weeks, the smart money commercial hedgers have increased their net short futures position by 170,000 contracts and are close to the most bearish they have been since June 2014 when crude oil was selling for $106/barrel. Crude basically crashed from there.
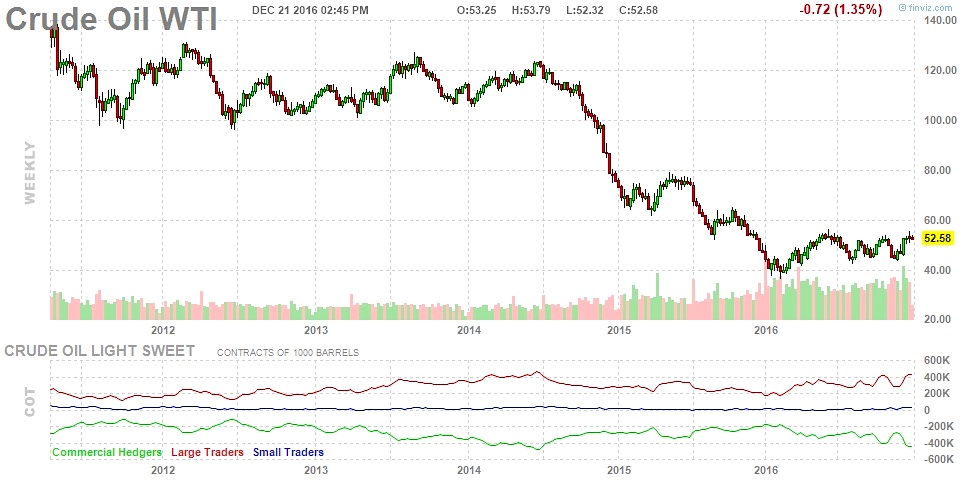
We basically have the same setup right now only on a smaller scale. From 2011 to 2014, crude traded in a big, wide consolidation, narrowing as we approached 2014. Obviously, the wide base today is much smaller in degree and time than the one earlier in the decade. Did I mention that the not so smart money, large speculators, are now almost as bullish as they were in June 2014. Look for the recent breakout attempt to fail and the potential for a large pullback/correction in crude oil in the weeks/months ahead. Should this play out, traders may see another early year crude oil cycle low.
Thanks for reading. Reach out to me at arbetermark@gmail.com for inquiries about my newsletter “On The Mark”, if interested.
Twitter: @MarkArbeter
Any opinions expressed herein are solely those of the author, and do not in any way represent the views or opinions of any other person or entity.


: Showing Some Signs of Emerging Strength")
