We have an oil market in indecision. Indecision = compression.
Crude oil price compression is building energy for a big move.
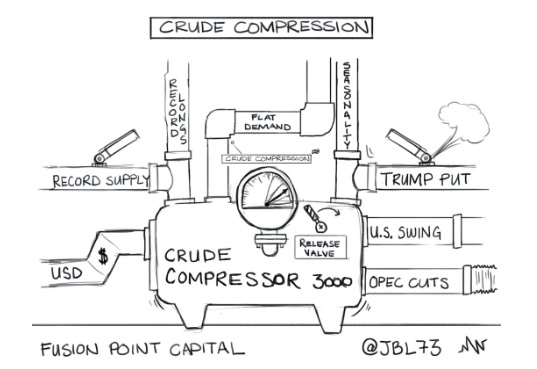
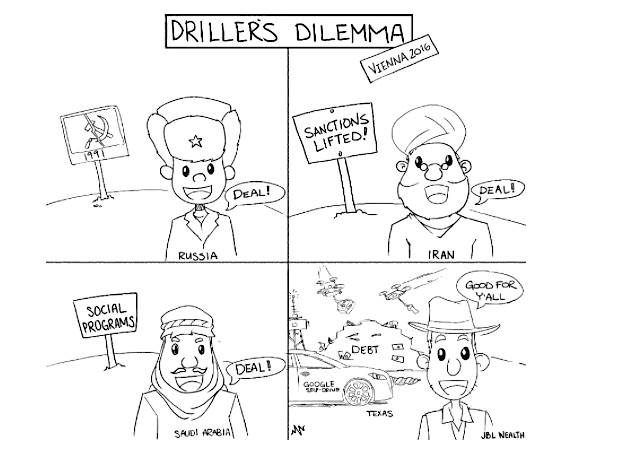
There a variety of influences at play in the crude oil market: (i) with Permian-mania as a new swing producer (quick production switch back on and total production costs down ~50% since 2014 for some producers due in part to continued technological advances), (ii) U.S. storage levels at all-time highs (rig counts rising by the week), (iii) flat U.S. demand growth, (iv) the “Indomitable Dollar” taking a breather at ~100 for now (the greenback combined with supply surpassing global demand in 2Q14 broke oil sending it spiraling down for 18 months), (v) bullish seasonality approaching, (vi) 90% OPEC compliance on production cuts agreed to in Vienna in late 2016 (Driller’s Dilemma), and of course (vii) the Trump reflation put.
Due to the final two influences (OPEC and Trump), record crude longs are betting the complex catches up to its parabolic peers. The bullish crude inverse head and shoulders technical pattern is there for everyone to see (below) and may be pushing bullish bets as well. Frustratingly for longs though, the crude market has been asleep for over two months since completing the pattern and sneaking above the neckline. 20-day historical volatility is at two year lows and the 10-day correlation with the S&P 500 slipped into negative territory last week (in early 2016 it was over 80 several times).
We have an oil market in indecision. Indecision = compression. Crude Oil price compression has building energy for a big move. The direction is unclear. Looking at my colleague Arun Chopra’s CFA CMT chart we can see the indecision in the number of weekly doji candles (look like little crosses) printed in a row (chart below with my bullets):
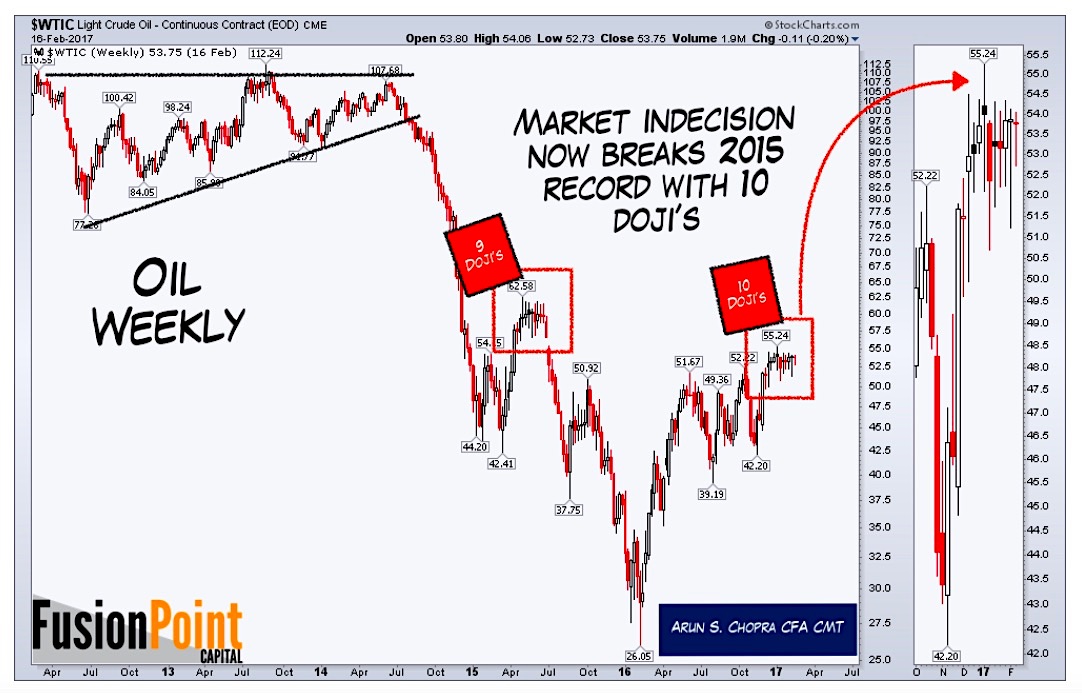
- Oil broke down out of multi-year triangle in summer 2014 as the U.S. dollar broke out of a multi-year base.
- After a countertrend bounce off the low $40s in early 2015, oil printed 9 weekly dojis (indecision) in the low $60s before resuming its slide.
- Now, crude has printed 10 weekly dojis in the low $50s, the longest streak since early 2015, just as the market looks to be completing a longer term reversal pattern.
It’s a push/pull scenario for crude in the low $50s. The Vienna OPEC production cuts and 90% compliance, the Trump put reflation trade, and bullish seasonality would seem to indicate the indecision would break higher. But, with the Permian Basin swing production in full ramp, U.S. inventory levels at all-time highs, continued rig count climbs, strong inventory builds, and the most bullish speculative futures position in over a decade, it may give one pause to bet on it here.
continue reading on the next page…

: Showing Some Signs of Emerging Strength")
