I can’t believe it’s been over a year since I posted on crude oil. I covered it last on See It Market in November 2015, and early in 2016 on my blog.
Back in November 2015, this is what I wrote about oil prices:
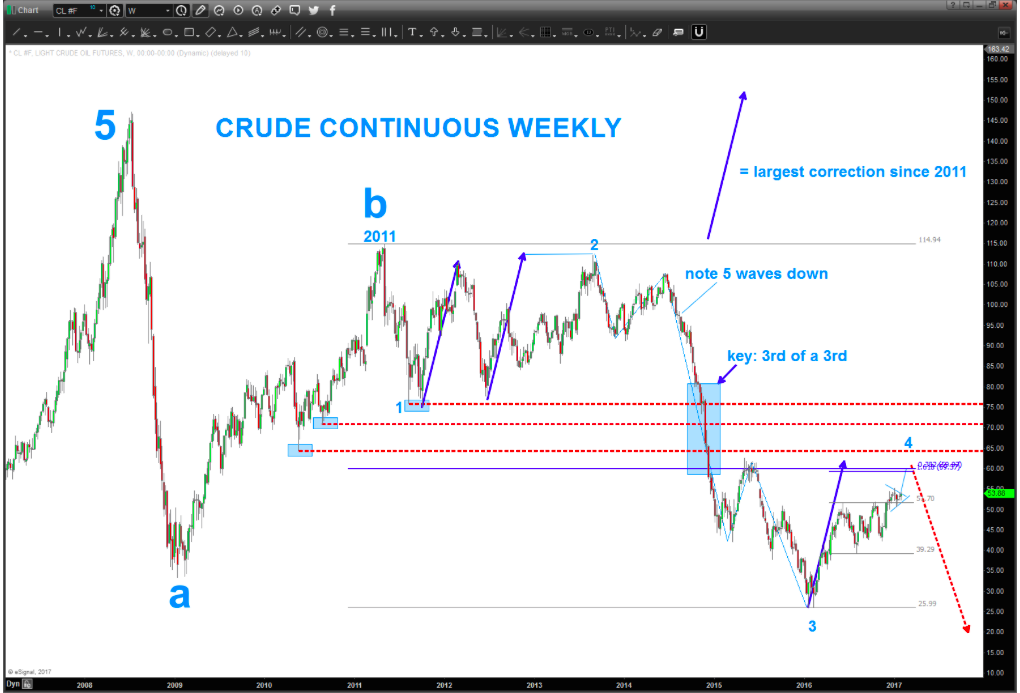
“If we lose $40 on Crude Oil then the possibility of another leg down in oil prices is real and the targets shown above (25-28) become a reality.”
And as you can see from the the chart in that post (and below), the ‘math’ tagged the low in crude oil.
More importantly, where do we go from here? Well, the ‘easy count’ and that’s what I’m into says – perhaps – a bit more rally higher and followed by a move lower that takes out $26?
Seems crazy, right? But you never know.
Crude Oil Chart – potential Elliott Wave pattern?
Not a “call” just an observation. Thanks for reading and happy trading.
Twitter: @BartsCharts
Author does not have a position in mentioned securities at the time of publication. Any opinions expressed herein are solely those of the author, and do not in any way represent the views or opinions of any other person or entity.

: Creating Bullish Divergence?")

: Creating Bullish Divergence?")


