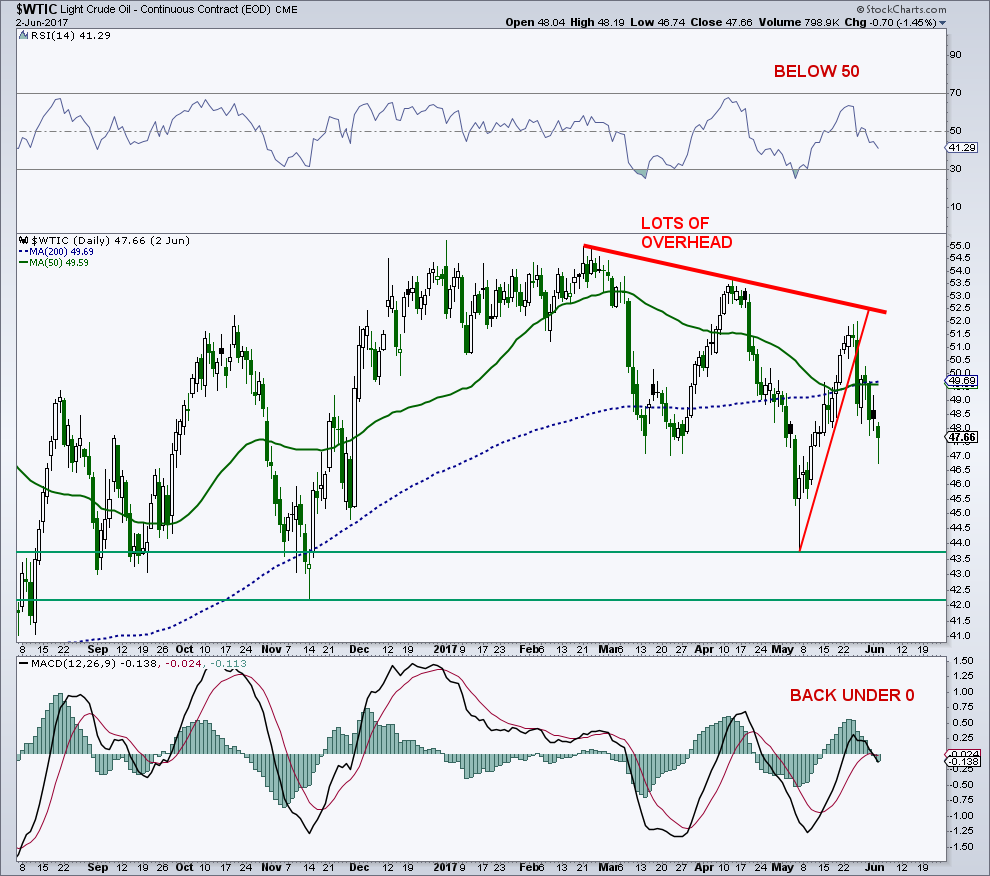
WTI Crude Oil has broken another counter trend rally attempt and currently sits below $48/barrel.
My recommendation to subscribers was to go short Oil last Thursday. I personally too a short position in the inverse Crude Oil ETF (NYSEARCA:SCO). Here’s why, and what I see going on in the chart (see below).
This next leg lower could potentially fall into the low 40’s. All this price volatility near the recent highs is bearish. As well, daily momentum is a concern with the 14-day RSI back below 50 and the daily MACD about to cross back into negative territory. The most damage in a correction occurs with this momentum combination.
Commercial hedgers or the so-called smart money are still short the futures market by a large degree, but not quite as bearish as they were earlier this year. They tend to cover shorts (reduce total positions) prior to the bottom in price. Large speculators still hold a fairly bullish futures position. This combo in the COT report has not been good for oil prices. The SPDR Energy Sector ETF (NYSEARCA:XLE) is showing little signs of life, despite being down almost 16% since December. Not a good sign. As I said, I am short crude via a small position in SCO.
Crude Oil Price Chart (through Friday, June 2)
Feel free to reach out to me at arbetermark@gmail.com for inquiries about my newsletter “On The Mark”. Thanks for reading.
Twitter: @MarkArbeter
The author has a position in the short crude oil ETF (SCO) at the time of publication. Any opinions expressed herein are solely those of the author, and do not in any way represent the views or opinions of any other person or entity.


: Showing Some Signs of Emerging Strength")
