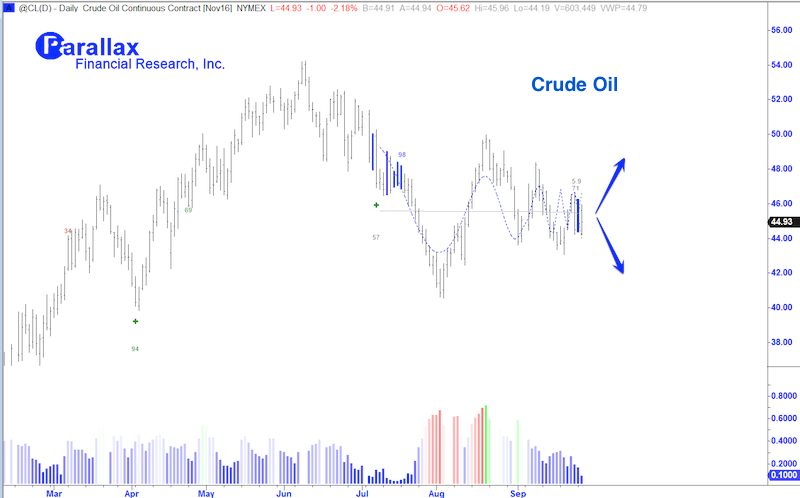
After an amazing snapback rally earlier this year, Crude Oil prices have spent time consolidating. In short, the tension is building as traders await Crude Oil’s next big move.
Crude Oil Chart & Price Action Insights
Yesterday Crude Oil futures (CL) signaled an extremehurst compression signal. This market signal is non-directional but indicates a new trend is about to emerge.
Theses signals are born out of “EXTREME MEAN REVERSION” or trendless environments. And further, they tend to initiate new trends that last at least the amount of time they took to build. In this case, the new trend could last 3 months or more.
So what’s the trigger here for Crude Oil? Well, looking at the chart below, you can see that we are waiting for a breakout or breakdown. And this is up to the market to decide. New excess supply or demand will tilt the equilibrium enough to be a catalyst for a strong price break. My inclination is that it may be to the upside, but patience is always a virtue with trading.
Crude Oil Chart
You can get read more of my research over at Market Inflections. Thanks for reading.
Twitter: @interestratearb
The author may have positions in mentioned securities at the time of publication. Any opinions expressed herein are solely those of the author, and do not in any way represent the views or opinions of any other person or entity.


