The chart and data that follow highlight non-commercial commodity futures trading positions as of September 18, 2018. This data was released with the September 21, 2018 COT Report (Commitment of Traders).
Note that this chart also appeared on my blog.
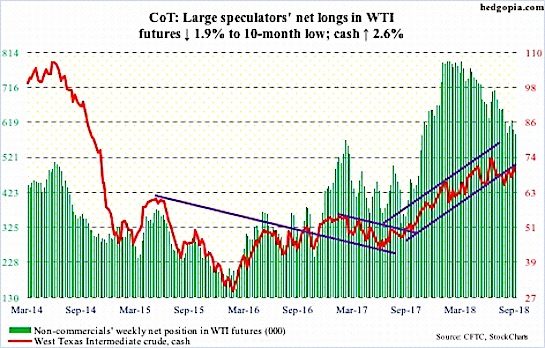
The chart below looks at non-commercial futures trading positions for Crude Oil futures. For the week, Crude Oil prices finished up +2.6%, with the United States Oil ETF (NYSEARCA:USO) closing down +3.2%.
Here’s a look at Crude Oil futures speculative positioning. Scroll further down for commentary and analysis.
Crude Oil is closing in on recent highs – will this prove to be resistance or will it break out? (see comments below).
Let’s look at the COT data and technical to see what’s next…
Crude Oil Futures: Currently net long 586.7k, down 11.4k.
Some data for the week ending September 14:
- US crude production rose 100K barrels per day to 11 million barrels per day.
- Production has remained around 11 million barrels per day for several weeks.
- The recent EIA report showed crude stocks falling just over 2 million barrels to 394 million barrels. This was the second reading under 400 million in as many weeks.
During September, WTI crude oil has failed at the $71 resistance level a handful of times. This bears watching. Oil prices have struggled since hitting multi-year resistance around $75. In addition to overhead resistance, oil is also testing its upper Bollinger band on the daily chart.
Twitter: @hedgopia
Author may hold a position in mentioned securities at the time of publication. Any opinions expressed herein are solely those of the author, and do not in any way represent the views or opinions of any other person or entity.


