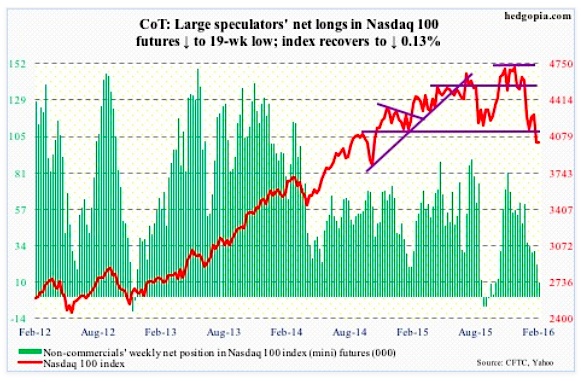
Nasdaq 100 Index (mini): Down as much as 3.4 percent on Monday’s intra-day lows, the Nasdaq 100 had an impressive end to the week – only down 0.13 percent. Has tons of room to rally from here – if nothing else just to unwind oversold conditions in tech stocks, both daily and weekly.
The nearest resistance lies at just under 4100, and the line can be drawn as far back as September 2014. Shorter-term averages lie around there as well, and they are still dropping. More consolidation is needed so they begin to hook up.
In the week ended Thursday, $665 million came out of QQQ, the PowerShares Nasdaq 100 ETF (courtesy of ETF.com).
Non-commercials continue to reduce net longs – now sub-10k. Holdings are at a 19-week low.
February 12 COT Report Data: Currently net long 9.6k, down 12.1k
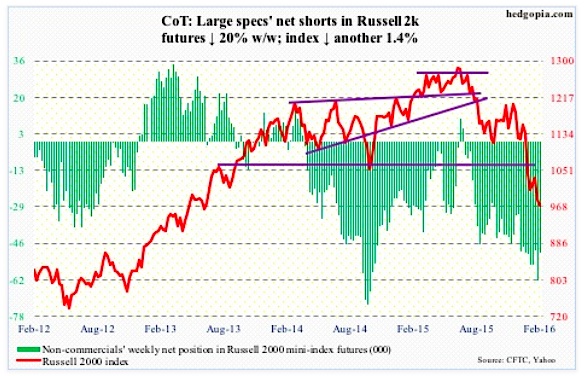
Russell 2000 mini-Index: In the week ended Wednesday, $492 million moved into IWM, the iShares Russell 2000 ETF (courtesy of ETF.com).
This was before Thursday’s action when the January 20th low was breached before staging a mini-reversal. A rally in small cap stocks is possible near-term, but needs to first take out 985 and then 1000.
Non-commercials reduced net shorts by 20 percent.
February 12 COT Report Data: Currently net short 49.5k, down 12.4k
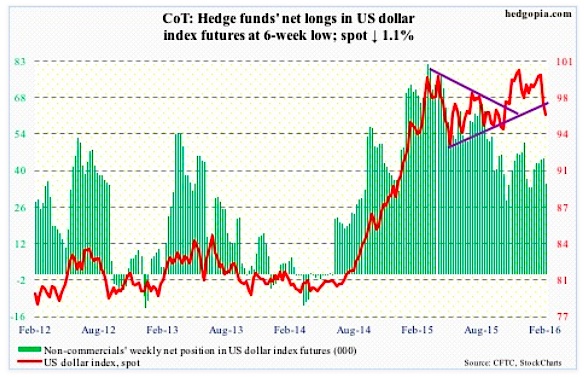
US Dollar Index: On a daily chart, the US Dollar Index is grossly oversold, and the action on both Thursday and Friday suggest a reprieve is in order at least near-term.
That said, the nearest resistance lies at just under 97, which also approximates the 200-day moving average (96.88).
Non-commercials continue not to show enthusiasm for the US Dollar Index. Net longs dropped 22 percent w/w.
February 12 COT Report Data: Currently net long 35k, down 9.9k
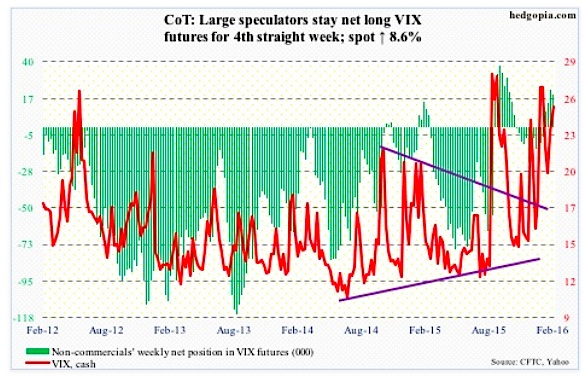
VIX Volatility Index: Spot VIX Volatility Index likely flashed a spike-reversal signal on Thursday, surging to 30.90 intra-day just outside the upper Bollinger Band. Friday, it closed at 25.40. There is plenty of room near-term for it to continue lower.
Intermediate-term, however, the 50-day moving average is now rising, as is its 200-day cousin, so they should provide support.
Incidentally, using intra-day highs on Thursday, the VIX-to-VXV ratio spiked to 1.05. This was followed by an intra-day reading of a 1.11 in the prior week. These are high readings, and once they begin to come under pressure, stocks tend to do well as volatility subsides.
February 12 COT Report Data: Currently net long 19.7k, down 2.8k
Twitter: @hedgopia
Read more from Paban on his blog.
Any opinions expressed herein are solely those of the author, and do not in any way represent the views or opinions of any other person or entity.


: Showing Some Signs of Emerging Strength")
