The chart and data that follow highlight non-commercial commodity futures trading positions as of July 17, 2018.
This data was released with the July 20 COT Report (Commitment of Traders). Note that this chart also appeared on my blog.
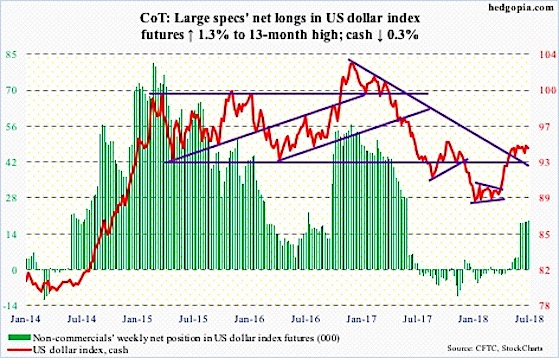
The chart below looks at non-commercial futures trading positions for U.S. Dollar Index futures. For the week, the U.S. Dollar spot price (CURRENCY:USD) declined by -0.3%, with the Bullish ETF (NYSEARCA:UUP) dropping similarly.
Here’s a look at U.S. Dollar Index futures speculative positioning. Scroll further down for commentary and analysis.
The U.S. Dollar Index is nearing its 50 day moving average…
What’s next? Let’s look at the COT data and technicals…
US Dollar Index Futures: Currently net long 18.9k, up 239.
The Dollar pushed up past the 95 market one more time last week before heading lower. That area has been resistance for the past few weeks.
Now the Dollar may be turning its attention to the 50 day moving average (around 94). And because the reversal off the highs Thursday to close near the lows (producing a long candle wick), the index looks poised to break down below the 50 day.
It’s probably best for traders to play it safe and see where the buck finds support.
Twitter: @hedgopia
Author may hold a position in mentioned securities at the time of publication. Any opinions expressed herein are solely those of the author, and do not in any way represent the views or opinions of any other person or entity.

: Showing Some Signs of Emerging Strength")
