The following chart and data highlight non-commercial commodity futures trading positions as of May 22, 2018.
This data was released with the May 25 COT Report (Commitment of Traders). Note that this chart also appeared on my blog.
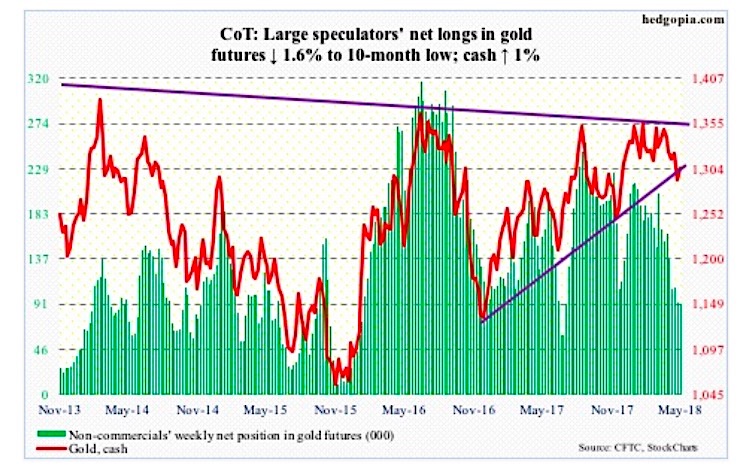
The chart below looks at non-commercial futures trading positions for GOLD. For the week, the GOLD (cash) rose +1.0%.
Here’s a look at GOLD futures speculative positioning. Scroll further down for commentary and analysis.
GOLD Futures: Currently net long 91k, down 1.5k.
Before GOLD prices jumped 1.2 percent Thursday, there were six straight sessions of long-legged dojis, spinning tops and hammers. Price support at $1,280, which represents a rising trend line from December 2016, has been defended.
Flows continue to be a negative, but technicals may be turning in the favor of gold bugs. The 200-day moving average is their next goal. The average, which approximates the broken-support-turned-resistance, is just overhead.
In the week to Wednesday, the SPDR gold ETF (GLD) lost $171 million, and iShares gold trust (IAU) $21 million (courtesy of ETF.com).
Twitter: @hedgopia
Author may hold a position in mentioned securities at the time of publication. Any opinions expressed herein are solely those of the author, and do not in any way represent the views or opinions of any other person or entity.
: Creating Bullish Divergence?")


 and Semiconductors (SMH): Concerning Price Pattern?")


