The following is a recap of The COT Report (Commitment Of Traders) released by the CFTC (Commodity Futures Trading Commission) looking at COT futures data and positions of non-commercial holdings. This recap and analysis uses COT futures data through March 22 (released March 25). Note that the change in COT futures data is week-over-week.
EQUITIES
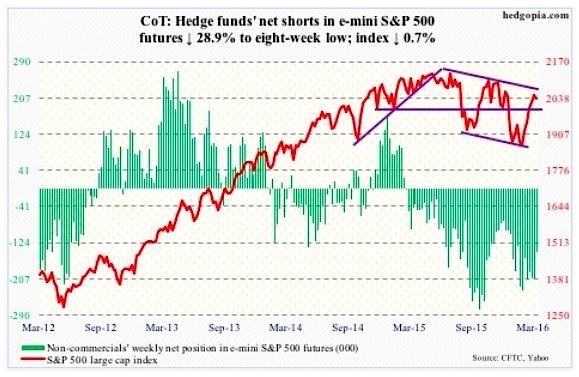
E-mini S&P 500: Last Tuesday produced a long-legged doji. And the early weakness on Thursday was bought right on mini straight-line support – just above the 200-day moving average. The session produced a long lower shadow (bullish); however, if it is a hanging man (bearish), suggesting that selling pressure is starting to increase, it needs confirmation. Right now, the index is sitting right on its 10-day moving average, which could begin to go flat.
For the week, the S&P 500 dropped 0.7 percent – first drop in six weeks for stocks. The $1.4 billion that moved into SPY, the SPDR S&P 500 ETF, in the week ended Wednesday is now under water; in fact, Monday through Wednesday, the ETF pulled in $4.1 billion (courtesy of ETF.com). Some level of distribution is taking place.
Also, Lipper data show that $2 billion moved into U.S.-based equity funds in the week ended Wednesday – second inflows in three weeks netting $4.5 billion. Encouraging trend, but probably too little to negate the prevailing trend. Since February 10th, $7.9 billion has been redeemed. The S&P 500 bottomed on February 11th.
COT Futures: Currently net short 146.4k, down 59.5k.
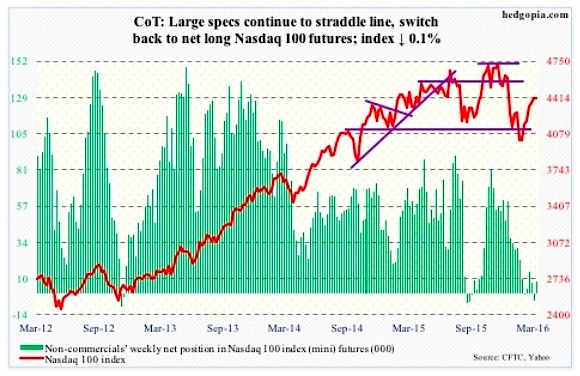
Nasdaq 100 Index (mini): Could have had six straight weeks of advance but missed by a mere five points. The index dropped 0.1 percent for the week, outperforming its major peers.
Amidst plenty of push and pull between bulls and bears, the Nasdaq 100 produced a weekly doji – possibly a signal that buying pressure is starting to weaken for stocks. If so, this is a win for the bears.
The index is still above 4350, but barely. As well, after a brief stay above the 200-day moving average, it is back under. QQQ, the PowerShares Nasdaq 1000 ETF, longs were not convinced the breakout was real, withdrawing $468 million in the week ended Wednesday (courtesy of ETF.com).
COT Futures: Currently net long 8k, up 12.4k.
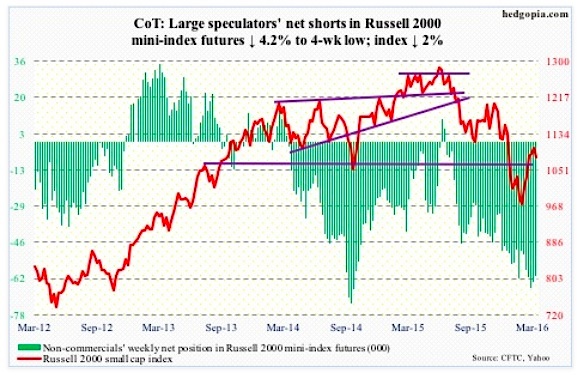
Russell 2000 mini-Index: The index of small cap stocks just suffered a daily bearish MACD crossover, and is literally sitting on 1080 support.
Shorter-term moving averages are beginning to go flat but are yet to roll over – a development that could very well be in the works. For the week, the index dropped two percent – much sharper than most of its U.S. peers.
IWM, the iShares Russell 2000 ETF, attracted $1.4 billion in the week ended Wednesday – $1.6 billion in the last two sessions (courtesy of ETF.com). These funds are now in the red, and will probably only get worse. The immediate risk is a drop to support at 1035, which also approximates the 50-day moving average.
COT Futures: Currently net short 60.8k, down 2.7k.
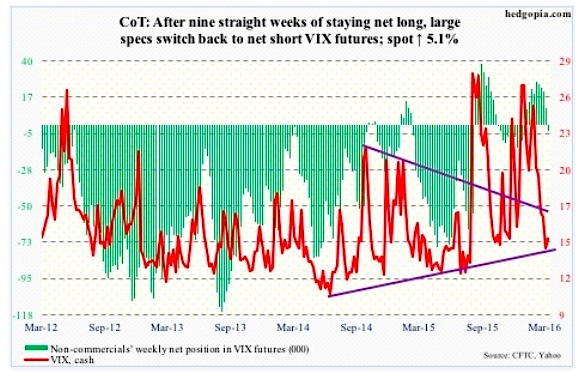
VIX: Spot VIX’s rally attempt on Thursday was repelled by its 20-day moving average. The bottoming process continues, with a weekly long-legged doji. Daily MACD is on the verge of a bullish crossover. And, the VIX to VXV ratio has dropped into oversold zone.
Here is a potentially important development. After nine weeks of staying net long, non-commercials switched to net short. The last time such a switch occurred was on October 27th last year, with the S&P 500 peaking on November 3rd.
COT Futures: Currently net short 4k, down 14.3k.
CURRENCIES
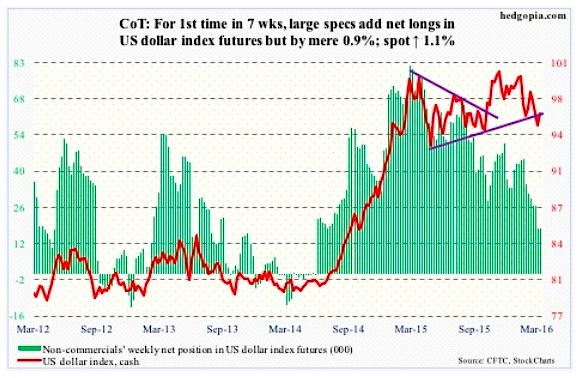
US Dollar Index: Rallied 1.1 percent in the week. Mr. Bullard’s comments possibly helped, but more importantly, it was probably looking for a reason to rally.
The index was meted out a harsh punishment last week when it dropped nearly two percent on Wednesday and Thursday, reacting to the Fed’s dovish shift. That also pushed daily momentum indicators into deep oversold territory. Now, weekly indicators are oversold as well.
The area of interest continues to be 97.
The index could very well be in the midst of a rebound near term. For that to transpire, it has to win back the broken May 2015 trend line.
That said, unless 100-101 is convincingly taken out, odds are decent that an important top has been reached.
Too early to take this as a signal, but for the first time in seven weeks, non-commercials added to net longs, albeit by a mere 0.9 percent.
COT Futures: Currently net long 17.7k, up 163.
continue reading on the next page…


