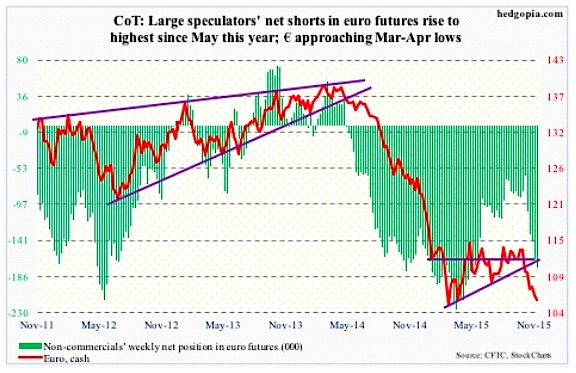
Euro: Will Mario Draghi, ECB president, deliver on December 3rd? Markets are bracing for something big. Mr. Draghi himself has hinted for a while that the bank would announce something this Thursday.
The question is not if he would oblige. He will. He will have to. He has suggested as much. The question is how markets will perceive whatever is announced. If the governing council just ends up cutting the deposit rate – already negative – and not extend the existing stimulus program, which runs through next September, odds are decent the euro rallies.
The currency is looking for a reason to move higher.
Alternatively, even if the ECB intends to eventually announce something big, it is possible it holds off until the January meeting.
Mr. Draghi does have a first-mover advantage over the Fed in that he has the discretion to wait until the Fed moves – or not – and save the big bazooka, if at all, until the January meeting. Keep the powder dry, so to speak.
It will be interesting to find out how the euro reacts in this scenario. The currency remains extremely oversold on a daily chart in particular, and it seems the Euro is itching to reverse direction (at least in the near term).
COT Report Data: Currently net short 175.5k, up 11.3k.
Gold: It is hard to put the finger on just exactly what gold is trading on these days.
Gold prices peaked in September 2011 right after QE2 (U.S.) ended, and continued lower even after QE3 got underway.
Now we are in the midst of QE in both the Eurozone and Japan. And Gold does not care.
Turkey downs a Russian jet. Gold does not care.
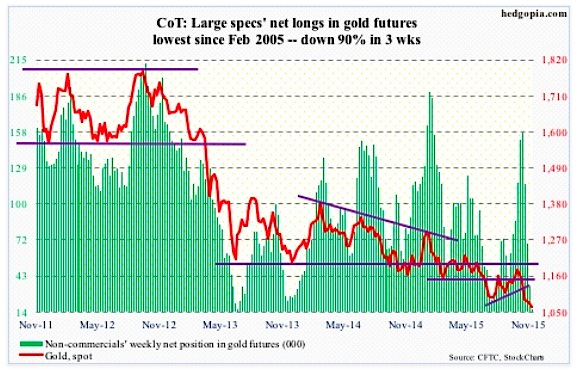
The yellow metal reaches an important technical level, and gold – or gold bugs – do not care. At 1,089, the spot retraced 50 percent of the July 1999-September 2011 surge, but buyers did not step up to defend that support. Gold is $25 below that level.
Spot gold’s daily chart in particular shows how oversold the metal is, but gold does not care. Before last Friday’s 1.3-percent drop, it was beginning to look like gold was trying to stabilize. Now the 1,070-1,080 region can act as resistance.
In the meantime, COT report data shows non-commercials’ net longs have dropped to the lowest since February 2005. Back then, net longs began to rise after bottoming at 11.2k contracts.
COT Report Data: Currently net long 16.3k, down 18.1k.
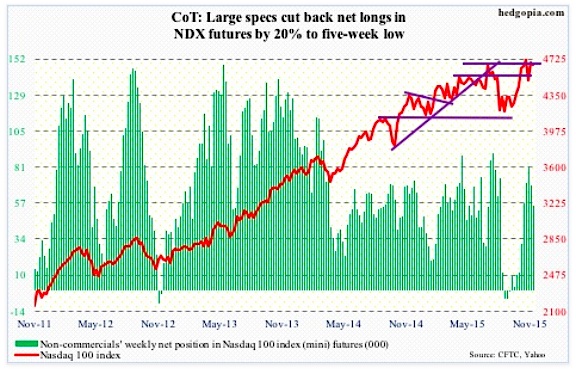
Nasdaq 100 Index (mini): Last week, the index was essentially flat, down 0.1 percent. Not bad given four of the top-five weights were down – Apple (AAPL) down 1.3 percent, Amazon (AMZN) up 0.7 percent, Facebook (FB) down 1.7 percent, Microsoft (MSFT) down 0.5 percent, and Alphabet (GOOGL) down 0.7 percent.
That said, in general the rally since the September 29th low has been led by large-caps – hardly healthy in a larger scheme of things.
Flows have been a suspect all along. Sine that low, a total of $11.7 billion has flown into U.S.-based equity funds (courtesy of Lipper) – decent but not great, given how powerful the rally has been. In the week ended last Wednesday, inflows were $2.9 billion, essentially offsetting the outflows of the prior two weeks.
COT Report Data: Currently net long 55.2k, down 13.6k.
Russell 2000 mini-Index: The moment of truth is upon small-cap bulls.
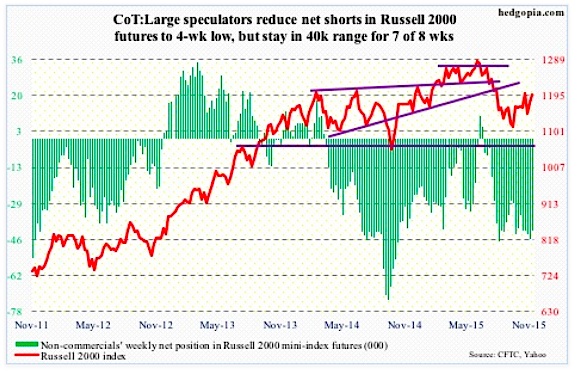
By last Friday, the Russell 2000 rallied nearly five percent in the last nine sessions, and with this is once again testing a make-or-break resistance. The 1210-1215 range has proven to be an important level going back to March last year.
After the August rout in stocks, that resistance has been tested twice – once in the middle of September and the other early last month. Both failed. So a lot is riding on this attempt for the Russell 2000.
On a weekly chart, there is room for the Russell 2000 to move higher still. Daily conditionsare beginning to get extended though. And the 200-day moving average is right above. The last time the Russell 2000 was above that average was on August 17th, right before the seven-day, 10-percent drop.
So it is hard to imagine a convincing breakout. Yesterday, IWM, the iShares Russell 2000 ETF, was rejected by its 200-day moving average.
Non-commercials continue not to buy the small-cap story.
COT Report Data: Currently net short 41.5k, down 3.8k.
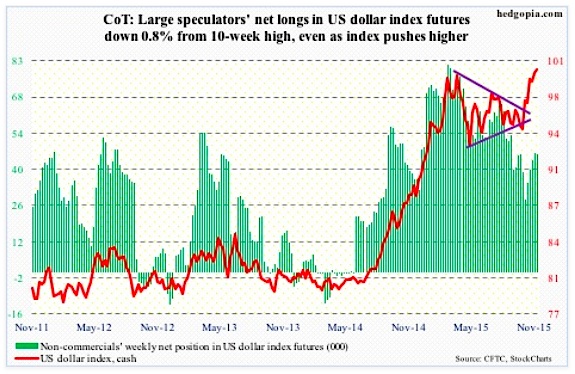
US Dollar Index: Back in March this year, the US Dollar index retreated after nearly retracing 61.8 percent of the July 2001-April 2008 decline. After a nearly seven-percent rally the past six weeks, the US Dollar index is back at the March highs. A convincing breakout here will be massive – and a nightmare for U.S. exports.
Needless to say, U.S. multinationals are an unhappy bunch. They must be hoping the US Dollar index does not stage a breakout.
That said, at least in the near term, the greenback is probably setting up for unwinding the overbought conditions it is in. Secondly, the US Dollar index has rallied primarily because of market expectations that the Fed would hike in two weeks’ time, and could very well be a victim of the ‘buy the rumor, sell the news’ phenomenon.
Per COT report data, non-commercials have never looked as enthusiastic as they were when the US Dollar index was trading at a similar level back in March/April. And for the first time in five weeks, they reduced net longs.
COT Report Data: Currently net long 46.1k, down 381.
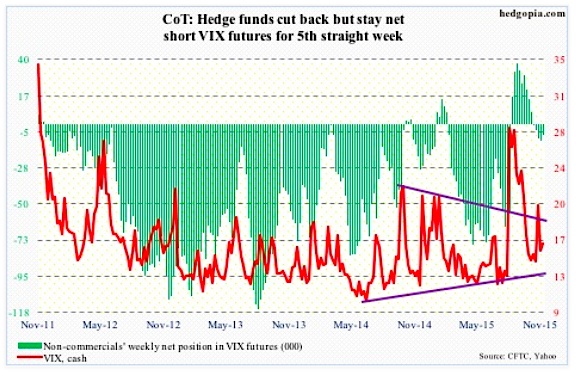
VIX (volatility index): For the past six sessions, spot VIX Volatility Index has been vacillating around its 200-day moving average. Yesterday, the VIX rallied nearly seven percent to close right underneath that, and could be setting up for further strength.
COT Report Data: Currently net short 7k, down 3.9k.
Thanks for reading.
Twitter: @hedgopia
Read more from Paban on his blog.
The author does not have a position in any of the mentioned securities at the time of publication. Any opinions expressed herein are solely those of the author, and do not in any way represent the views or opinions of any other person or entity.

