U.S. multinationals can breathe a little easier. Maybe.
U.S. exports are under pressure… and it has been that way for a while now. Look no further than a strong Dollar, but more on that later.
Nominally, U.S. exports of goods and services peaked at a seasonally adjusted annual rate of $2.36 trillion in 3Q14, dropping to $2.26 trillion four quarters later. Using monthly numbers, the 12-month rolling total peaked at $2.34 trillion last December, and dropped to $2.28 trillion by September this year.
On a real basis, exports of goods and services peaked at $2.124 trillion in 4Q14. After a brief dip in 1Q15, they rose sequentially in both the second and third quarters. In fact, the 3Q15 total of $2.122 trillion was only a hair’s breadth away from the peak three quarters ago.
That said, the fact remains that in a larger scheme of things exports have been decelerating. Most recently, exports’ contribution to real GDP growth has been decelerating since 4Q13. In 3Q15, it only contributed 0.11 percent to GDP growth of 2.1 percent (see chart 1 below).
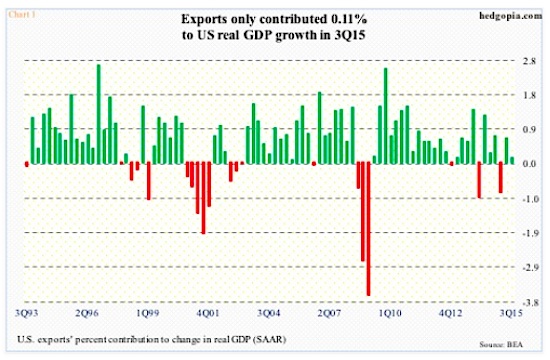
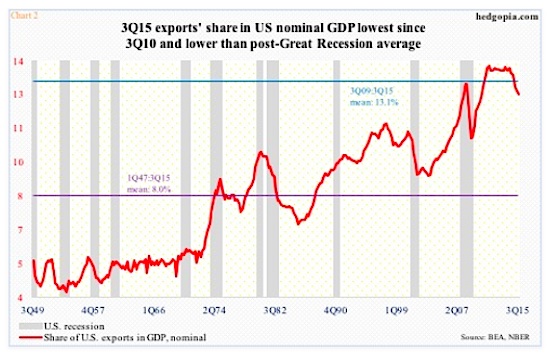
Chart 2 below drives this point home even better. In 3Q15, exports’ share in U.S. nominal GDP was 12.5 percent – the lowest since 12.4 percent in 3Q10. The red line peaked as early as 3Q11 at 13.7 percent, with 4Q13 matching that high, before coming under sustained pressure. The 3Q15 share is lower than the post-Great Recession average of 13.1 percent.
On a side note, notice how a sustained decline in exports has tended to accompany contraction in the economy (see chart 2).
The primary reason for exports slump is lackluster growth globally. And a strong dollar is dragging on the U.S. exports.
But it is not just the U.S. Exports are weak everywhere around the world.
In October, China’s exports fell 6.9 percent year-over-year – its fourth consecutive down month. Taiwan’s dropped 11 percent – ninth straight monthly contraction. South Korea’s slumped 15.8 percent. Singapore’s fell 0.5 percent. And Japan’s fell 2.1 percent – first monthly drop in 14 months.
This is the reason why countries feel the need to indulge in competitive devaluation.
As far as the U.S. is concerned, a strong dollar has been a headwind, rather than a tailwind. The US dollar index has rallied 25 percent since then. And in so doing, it has retraced 61.8 percent of the July 2001-April 2008 decline (Chart 3). This is a significant retracement level for Fibonacci followers.
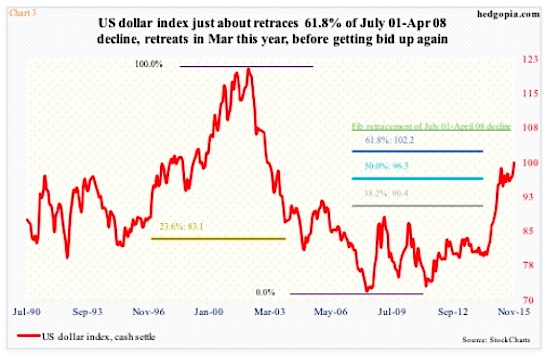
Back in March this year, the us dollar index retreated after spiking to 100.72, nearly completing the afore-mentioned retracement. After a subsequent sideways/down move, it began to once again attract bids in October, and a strong dollar is now testing the March highs.
A convincing breakout here can have immense consequences – for U.S. multinationals, for U.S. exports, for the economy, for commodities in general, and what not. But what are the odds of that happening?
continue reading on the next page…


