The following is a recap of the recent Commitment of Traders Report (COT) released by the CFTC (Commodity Futures Trading Commission) looking at Commitment of Traders data and commodity futures positions of non-commercial holdings as of May 2.
Note that the change in COT report data is week-over-week. Excerpts of this blog post also appear on Paban’s blog.
3 Commitment of Traders report charts kooking at spec futures positions in key commodities like Gold and Crude Oil, along with the US Dollar.
CRUDE OIL
Currently net long 407.2k, down 34.4k.
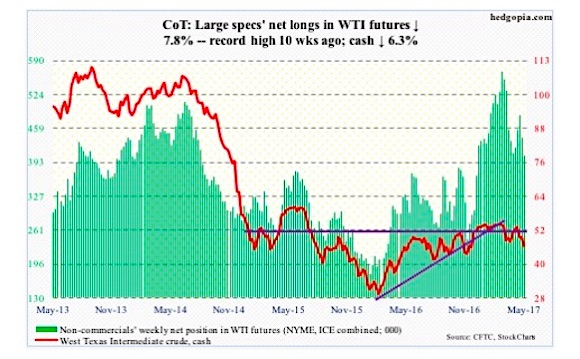
From the inventory perspective, the latest EIA report saw improvement, but oil bulls were unable to cash in. Wednesday, the day the report came out, spot West Texas Intermediate crude inched up 0.3 percent, but momentum was already down, having lost the 200-day moving average Monday.
Come Thursday, it collapsed 4.8 percent, losing support at $47 and change. The intraday low of $45.29 in that session matched the pre-OPEC agreement close of $45.23. Friday’s reversal candle in which the crude dropped to $43.76 intraday before closing up 1.5 percent to $46.22 essentially tested support at $43 – so far successfully.
In the week ended April 28, Crude production continued to inch higher – up 28,000 barrels/day to 9.3 million b/d. Since OPEC reached a cutback agreement late November last year, U.S. crude production has increased by just under 600,000 b/d.
U.S. crude stocks fell 930,000 barrels to 527.8 million barrels. This was the fourth straight week-over-week drop since reaching a record 535.5 million barrels four weeks ago.
Distillate inventory dropped 562,000 barrels to 150.4 million barrels. Gasoline stocks, however, rose 191,000 barrels to 241.2 million barrels – a six-week high.
Crude imports dropped 648,000 b/d to 8.3 mb/d. The prior week was an 11-week high.
Refinery utilization fell eight-tenths of a point to 93.3 percent. The prior week’s 94.1 percent was the highest since late November 2015.
GOLD
Currently net long 189.6k, down 11k.
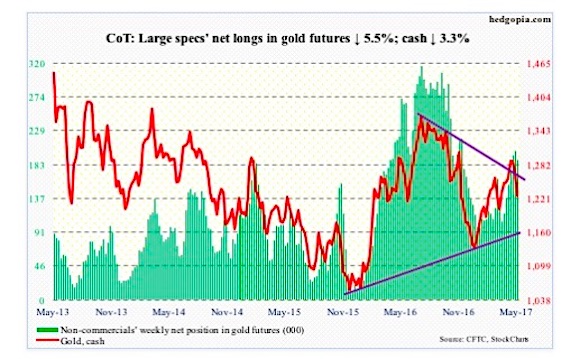
Commodities took it on the chin this week. Gold (cash) was no exception, losing both 50- and 200-day moving averages.
On April 17, the metal ($1,226.90) rallied to $1,297.40 before getting rejected by a falling trend line from September 2011 when it peaked at $1,923.70. A breakout would have been a major development.
There is decent support at $1,180-$1,190.
In the week ended Wednesday, GLD, the SPDR gold ETF, lost $36 million (courtesy of ETF.com).
U.S. DOLLAR INDEX
Currently net long 40k, down 3.5k.
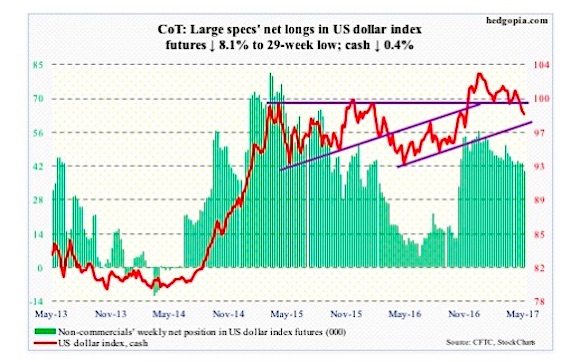
The cash has stopped responding to the shorter end of the Treasury yield curve. The Fed funds rate has gone up 75 basis points since December 2015, with more hikes probably on the way.
After rallying nearly 26 percent in nine months to 100.71, the dollar index peaked in March 2015. That high has proven to be an important level. The last time the index got rejected at that resistance was a month ago.
This week, it continued to hover around its 200-day moving average before ending the week 0.5 percent away from it. A couple of weeks ago, the dollar index lost a rising trend line from last May, the underside of which is likely to provide resistance when it rallies.
Kudos to non-commercials for not buying the ‘dollar set to massively rally’ meme that was particularly prevalent last year.
Thanks for reading.
Twitter: @hedgopia
Author may hold a position in mentioned securities at the time of publication. Any opinions expressed herein are solely those of the author, and do not in any way represent the views or opinions of any other person or entity.


")